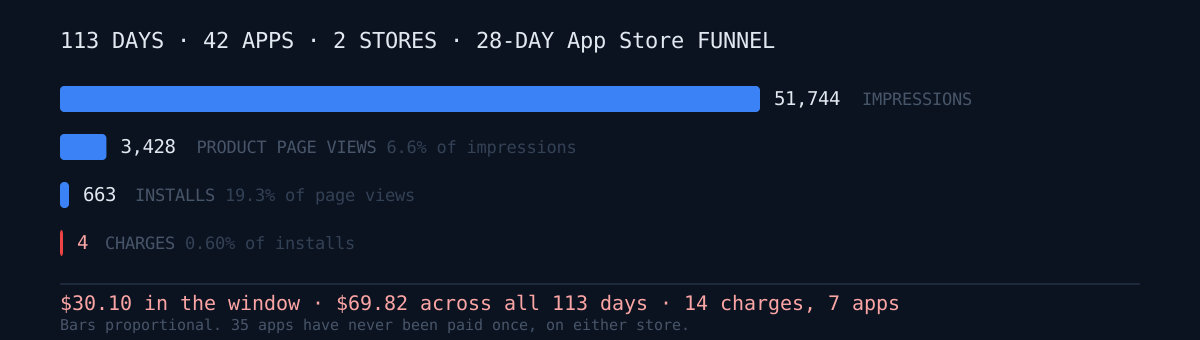
Open your store dashboard for a second. Say it shows 50,000 impressions. What revenue should that produce?
I have a measured answer. 51,744 impressions over 28 days → 4 actual charges → $30.10. And across the full 113 days since my first release, both stores together produced 14 charges totalling $69.82. From 42 apps.
This post is not a summary, it is a ledger. Every one of the 14 charges with its date, amount, currency and country, and the store link for every app. Hiding the numbers would leave nothing worth writing.
The first charge wasn't on iOS, and it was refunded in 18 minutes
The start line is 20 April 2026. FreshSave went live on Google Play that day, and the first subscription charge arrived the same day.
2026-04-20 05:59:57 PDT  Charge         FreshSave Pro Monthly  USD 1.70
2026-04-20 05:59:57 PDT  Google fee                            USD -0.26
2026-04-20 06:18:14 PDT  Charge refund  (Full)
2026-04-20 06:18:14 PDT  Google fee refund
18 minutes and 17 seconds between the first money and a full refund. I didn't know about it for months, because I had never read a single Play financial report. The Reporting API is disabled on that project, so I concluded "Android data is inaccessible" and moved on. In fact one fragment of a bucket name was wrong (separate post), and when I finally opened the earnings/ and sales/ prefixes today there were exactly two report files: April 2026 and May 2026.
Play only generates a report for months that had transactions. So the file count is the answer. Android charges in June, July and August: zero.
On 20 May the same order renewed once for $1.70 (minus a $0.26 fee, $1.44 net). That is the entirety of Android revenue. 113 days, two Android apps, $1.44 net.
Then I shipped 42 apps
| Period | new iOS releases |
|---|---|
| 21–30 April | 15 |
| May | 18 |
| June | 8 |
| July | 1 |
| August | 0 |
Fifteen in the first ten days. One in July. The deceleration wasn't fatigue — it was the earlier apps' numbers starting to arrive.
That single July app is Quieta. It shipped last of the 42 and it is currently the top earner.
The whole ledger — 14 charges
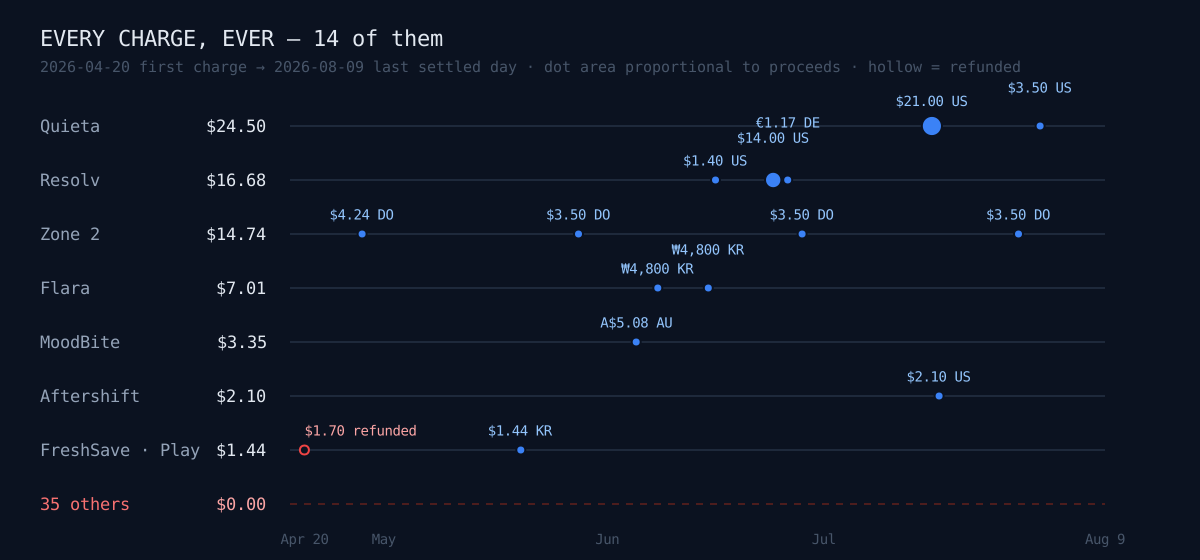
| Date | App | Product | Proceeds | Country | Type |
|---|---|---|---|---|---|
| 2026-04-20 | FreshSave (Play) | Pro Monthly | $1.70 → fully refunded | KR | new |
| 2026-04-28 | Zone 2 | Monthly | $4.24 | DO | new |
| 2026-05-20 | FreshSave (Play) | Pro Monthly | $1.44 | KR | renewal |
| 2026-05-28 | Zone 2 | Monthly | $3.50 | DO | renewal |
| 2026-06-05 | MoodBite | Pro Monthly | A$5.08 | AU | new |
| 2026-06-08 | Flara | Pro Monthly | ₩4,800 | KR | new |
| 2026-06-15 | Flara | Pro Monthly | ₩4,800 | KR | new |
| 2026-06-16 | Resolv | Pro Monthly | $1.40 | US | new |
| 2026-06-24 | Resolv | Pro Yearly | $14.00 | US | renewal (trial conversion) |
| 2026-06-26 | Resolv | Pro Monthly | €1.17 | DE | new |
| 2026-06-28 | Zone 2 | Monthly | $3.50 | DO | renewal |
| 2026-07-16 | Quieta | Pro Annual | $21.00 | US | renewal (trial conversion) |
| 2026-07-17 | Aftershift | Pro Monthly | $2.10 | US | new |
| 2026-07-28 | Zone 2 | Monthly | $3.50 | DO | renewal |
| 2026-07-31 | Quieta | Pro Monthly | $3.50 | US | renewal |
The sum is USD 56.74 + AUD 5.08 + KRW 9,600 + EUR 1.17 + Play USD 1.44, which converts to roughly $69.82 at static rates. Net of the refunded April charge, 14 charges stand.
Three things are visible immediately.
One. Two annual purchases are 50% of everything. $14.00 + $21.00 = $35.00, which is 50.1% of $69.82. The other twelve charges are monthly subscriptions between $1.17 and $4.24. Twelve monthlies do not beat two annuals.
Two. Exactly one person paid four months in a row. 28 April, 28 May, 28 June, 28 July — a Zone 2 subscriber in the Dominican Republic. Four charges, $14.74. That one person is 21% of all fleet revenue. No other relationship survived past two charges.
Three. The two largest charges landed the day a free trial ended. Quieta shipped on 9 July and was charged $21.00 on 16 July. Seven days. Trial conversion made the money, which means it wasn't the paywall copy — it was that the app was still open on day seven.
The seven apps that were ever paid
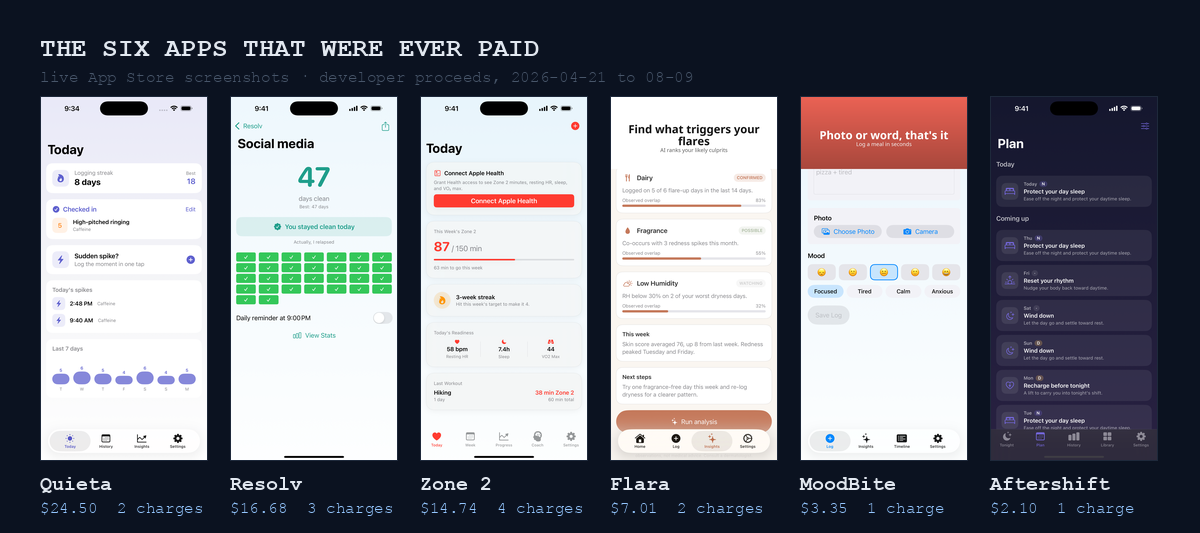
The screenshots above show six. The seventh is FreshSave, which was never charged on the App Store and was only ever paid on Google Play.
| App | Proceeds | Charges | Store |
|---|---|---|---|
| Quieta | $24.50 | 2 | App Store |
| Resolv | $16.68 | 3 | App Store |
| Zone 2 Longevity Coach | $14.74 | 4 | App Store |
| Flara | $7.01 | 2 | App Store |
| MoodBite | $3.35 | 1 | App Store |
| Aftershift | $2.10 | 1 | App Store |
| FreshSave (Play) | $1.44 | 1 | App Store · Google Play |
Seven out of 42. Thirty-five have never been paid once, on either store.
The most-seen app earns nothing
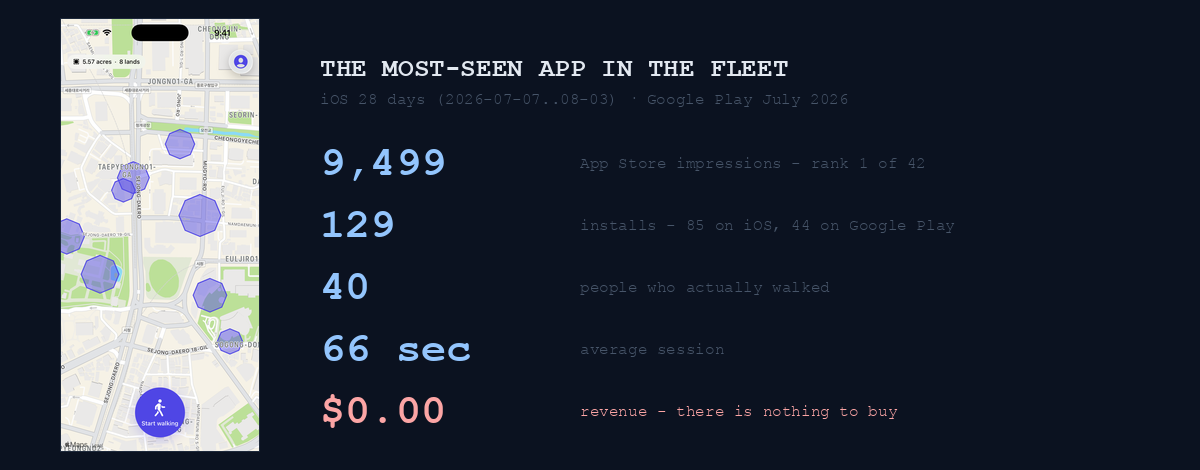
Plotta took 9,499 impressions in 28 days, first of the 42. Eighty-five iOS installs, 44 Play installs in July. Forty people actually walked, and the average session is 66 seconds.
Revenue: $0.00. There is nothing to buy. Zero subscriptions, zero IAPs.
And it isn't just Plotta. Sixteen of the 42 apps have no products at all, and those sixteen take 52% of impressions (26,690) and 56% of installs (370). That count isn't an estimate — I queried inAppPurchasesV2 and subscriptionGroups per app today and counted. They happen to be the best converters on the page → install step — Nomori 60.9%, RoadEye 41.7%, K-Pop Heardle 34.4%. The traffic is concentrated in the apps that are best at receiving it and worst at selling.
The same pattern over an 84-day window is I grew installs 52% and revenue didn't move a cent, and the inverse correlation between impression rank and revenue rank is in my most-impressed app earned zero.
Only one term in the chain was broken
2026-07-07 to 08-03, all 42 iOS apps combined.
impressions        51,744
product page views  3,428   (6.6%)
installs              663   (19.3%)
charges                 4   (0.60%)
revenue            $30.10
The first three terms are normal. 6.6% impression → page view and 19.3% page view → install are unremarkable numbers. The broken term is install → charge at 0.60%, plus the absolute impression volume in front of it (44 per app per day).
Folded into unit economics:
- revenue per install $0.045
- per 1,000 impressions $0.58
- but one app in the fleet earns $2.04 per install (Quieta: 12 installs in the window → $24.50)
$2.04 ÷ $0.045 = 45×. That gap isn't traffic. Same store, same impressions, same developer. The gap opens after the install.
This is where it splits. If you have three apps or fewer, this conclusion isn't yours — you have no sample yet, so growing impressions is the right move. If you have more than ten and revenue hasn't left double-digit dollars, the next section is about you.
I did the arithmetic to $1,000/month
Set the goal at $1,000 a month and substitute today's values.
$1,000 ÷ $0.045 (revenue per install) = 22,222 installs/month
current                               = about 685 installs/month
required multiple                     = 32×
ASO does not produce 32×. The strongest lever I have actually measured is an icon swap at 3.09× (Throne) and a custom product page at 2.4× (Cyra). Even if those succeeded on all 42 apps, they move only the front terms — revenue 2–3×, stalling around $90/month.
Which is why there is no case for a 43rd app. The most expensive part of this post is that I needed 42 apps before the arithmetic was available.
Android is two apps, and it uninstalls four times faster
Two packages have data on Play.
| Package | lifetime install events | uninstalls | active devices now |
|---|---|---|---|
| Plotta | 67 | 40 | 38 |
| FreshSave | 47 | 34 | 15 |
Plotta's July was 44 installs against 22 uninstalls — a 50% uninstall rate. The same app on iOS sits at 12%. Store listing visit → acquisition is also lower on Play: 6.2% (551 → 34) versus 8.0% on iOS (1,056 → 85) in the same month.
Account data flips the picture harder. Login provider breakdown is google 128 · apple 112 · email 24. Half my accounts are non-iOS, and for 113 days I judged the business on iOS reports alone.
All 78 ratings came from one country
Scraping the ratings the stores actually display — itunes.apple.com/lookup across kr, us and jp — gives 78 today.
All 78 are KR. The US and Japan are zero across all 42 apps. The US is my largest install market (390 installs over 110 days).
The in-app rating prompt already ships in all 42. So the cause isn't a missing prompt — it's that no non-Korean user reaches the gate (3 days installed plus one core action completed). It's the same wall as the 12–15% uninstall rate and the 66–84 second sessions. Five apps have zero ratings: Quieta, Throne, Aftershift, Itda, Pixogue. Incidentally, the App Store Connect API never exposes an average rating at all — also its own post.
My instrumentation lied to me twice
Before asking you to trust these numbers, it's only fair to record where the same pipeline handed me wrong ones.
One, the funnel was inflated 3×. My first report said 144,232 impressions and 9,218 page views. The tool was summing restatements of ASC's ONGOING report instances, which produced a misdiagnosis: "page view → install is the biggest leak." The real bottleneck was total impressions. → my analytics counted the same day three times
Two, every app had identical user counts. A trigger on auth.users in the shared Supabase created a profile row in every app schema on any signup, so each app's "264 new users" was really 264 fleet-wide signups. A verdict I built on that number ("88% of new users churn") had the wrong denominator. → every app had the same 264 new users
So the revenue in this post comes only from settlement reports, never analytics: SALES SUMMARY DAILY on iOS, the earnings/ and sales/ ZIPs on Android. The analytics-side "subscription starts" mix in free trials and intro offers and always overstate.
What I'm doing now, and what I'm not
Action 1 — retarget the cross-promo banner (no build, ~1 hour). The banner shipped in 32 apps was pointing at an app still in review. One remote JSON edit pointed it at the app with proven charges (Quieta). Each app renders only the first matching entry, so array order is priority, and the old entry stays in the file as enabled:false — restoring it is a reorder.
Action 2 — first-session instrumentation for Plotta on both platforms. Knowing "only 40 people walk" didn't tell me where they're lost, because everything between account creation and first success was invisible. Eight events, one contract, both platforms. First seven days:
first open              4 devices  100%
location permission     2 devices   50%
permission result       2 devices  100%  (all authorized)
walk started            2 devices  100%
walk ended              0 devices    0%
territory claimed       0 devices    0%
Four devices proves nothing. But two starts and zero completions matches the hypothesis: a territory only exists once you've walked a closed loop outdoors, so a first session indoors makes success structurally impossible.
Adding the instrumentation bit me twice. xcodebuild test boots the host app in the simulator, so the test suite wrote ten rows into production telemetry (post), and five minutes after submitting for review two devices sent events from a build that wasn't public yet — Apple's review automation (post). The reader tool now always prints a platform/version breakdown. Traffic on an unreleased version is not a user.
Not doing: a 43rd app; a fleet-wide ASO wave; monetising Plotta (40 users × an optimistic 5% × $14.99/year ≈ $30/year, against entitlement work across iOS, Android and web); re-shooting screenshots.
Five checks you can run today
If you run several apps, check in this order. I did it in reverse and it cost me 113 days.
- Does your most-impressed app have a purchase screen at all? If not, you are burning half your inventory for free.
- Are you reading revenue from settlement reports? Analytics "subscription starts" include trials.
- Have you ever opened the other store's financial reports? Play only writes a file for months with transactions — the file listing itself is the answer.
- Is your biggest install market at zero ratings? Then it isn't the prompt; those users never reach the gate.
- What is the multiple between your best revenue-per-install app and your average? If it's double digits, your next job isn't traffic.
Honestly, the limits of this post
- The conversion is approximate. A static FX table makes $69.82 a ranking figure, not accounting. That's why the original per-currency amounts are printed above.
- Four days of iOS settlement reports were missing (404 on 4 of 115 days). If charges landed there, the total is slightly higher.
- There is no web revenue at all. One app has a web client with an unfinished payment path, so a user who paid on iOS appears as a free user there.
- Review counts can't be trusted. ASC's
customerReviewsunder-reports real reviews — one app shows three in the UI and zero via the API in every query shape. The rating count (78) comes from a different source and is unaffected. - The sample is tiny. Fourteen charges cannot support a paywall A/B or a pricing experiment. That's why the conclusion here is arithmetic on a multiplication chain, not an experiment result.
- The list below has 41 apps, not 42. One is omitted because its app name is a personal name.
All 41 apps
| # | App | First release | Category | Ratings | Store |
|---|---|---|---|---|---|
| 1 | PulseCalm | 2026-04-21 | Health & Fitness | 4 | App Store |
| 2 | Zone 2 Longevity Coach | 2026-04-21 | Health & Fitness | 5 | App Store |
| 3 | Biasly Pro | 2026-04-22 | Education | 4 | App Store |
| 4 | Innra | 2026-04-22 | Health & Fitness | 4 | App Store |
| 5 | GutLog AI | 2026-04-23 | Health & Fitness | 3 | App Store |
| 6 | MoodBite | 2026-04-23 | Health & Fitness | 3 | App Store |
| 7 | FreshSave | 2026-04-24 | Food & Drink | 4 | App Store · Google Play |
| 8 | Cyra | 2026-04-26 | Health & Fitness | 3 | App Store |
| 9 | Sage | 2026-04-26 | Health & Fitness | 2 | App Store |
| 10 | Culprit | 2026-04-27 | Health & Fitness | 2 | App Store |
| 11 | Petport | 2026-04-27 | Travel | 1 | App Store |
| 12 | PeriTrack Pro | 2026-04-28 | Health & Fitness | 2 | App Store |
| 13 | Slimroll | 2026-04-28 | Photo & Video | 3 | App Store |
| 14 | Aurnia | 2026-04-30 | Health & Fitness | 2 | App Store |
| 15 | HQLens | 2026-04-30 | Finance | 1 | App Store |
| 16 | Flara | 2026-05-03 | Health & Fitness | 4 | App Store |
| 17 | Expra | 2026-05-04 | Finance | 2 | App Store |
| 18 | Nomori | 2026-05-04 | Games | 3 | App Store |
| 19 | Repvy | 2026-05-04 | Health & Fitness | 1 | App Store |
| 20 | Solca | 2026-05-05 | Health & Fitness | 1 | App Store |
| 21 | Paxio | 2026-05-06 | Health & Fitness | 2 | App Store |
| 22 | Chunja | 2026-05-15 | Education | 2 | App Store |
| 23 | Pawport | 2026-05-15 | Travel | 1 | App Store |
| 24 | K-Pop Heardle | 2026-05-19 | Games | 2 | App Store |
| 25 | Onnal | 2026-05-19 | Lifestyle | 1 | App Store |
| 26 | Gravity Duel | 2026-05-20 | Games | 2 | App Store |
| 27 | Plotta | 2026-05-21 | Games | 2 | App Store · Google Play |
| 28 | RoadEye Pro | 2026-05-26 | Navigation | 1 | App Store |
| 29 | Stelo | 2026-05-26 | Games | 2 | App Store |
| 30 | Territory Arcade | 2026-05-27 | Games | 1 | App Store |
| 31 | Pixogue | 2026-05-28 | Games | 0 | App Store |
| 32 | Clearfield | 2026-05-29 | Games | 1 | App Store |
| 33 | HiddenGem Korea | 2026-06-01 | Travel | 1 | App Store |
| 34 | Brewra | 2026-06-11 | Food & Drink | 1 | App Store |
| 35 | Streaklet | 2026-06-12 | Productivity | 1 | App Store |
| 36 | Resolv | 2026-06-16 | Health & Fitness | 1 | App Store |
| 37 | Reelo | 2026-06-18 | Photo & Video | 2 | App Store |
| 38 | Throne | 2026-06-22 | Health & Fitness | 0 | App Store |
| 39 | Aftershift | 2026-06-23 | Health & Fitness | 0 | App Store |
| 40 | Itda | 2026-06-25 | Games | 0 | App Store |
| 41 | Quieta | 2026-07-09 | Health & Fitness | 0 | App Store |
Every app is a free download; all revenue comes from subscriptions and IAPs. First-release dates and rating counts were read from the live stores today via itunes.apple.com/lookup. One further app is missing from the list because it is still in review.
One last question
113 days, 42 apps, $69.82. What those numbers taught me was the opposite of "ship more apps." The traffic already existed, and half of it flowed into apps with no purchase screen.
So the question I'll leave you with is this.
Open your highest-impression app right now. How many taps to a screen where a user can pay? Or is there no such screen at all?