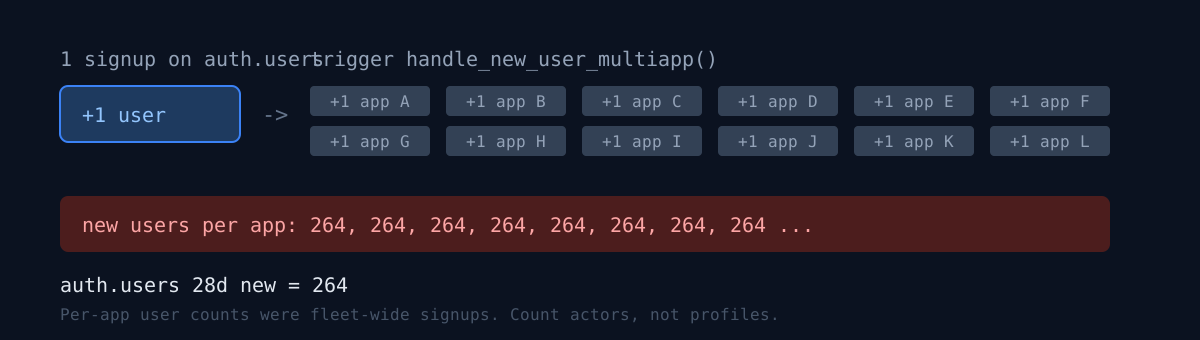
Twenty-odd apps share a single Supabase project, split by schema: plotta.users, zone2.users, sage.users, moodbite.profiles, and so on. I'd been counting "new signups in 28 days, and how many of them actually used the thing" per app to decide where to spend my time.
On 2026-08-10 I pulled per-app activity into one table and the numbers looked wrong.
pulsCalm.profiles   28d new 264   7d 76
petpass.profiles    28d new 264   7d 76
sage.users          28d new 264   7d 76
bloatless.profiles  28d new 264   7d 76
moodbite.profiles   28d new 264   7d 76
plotta.users        28d new 264   7d 76
innra.profiles      28d new 264   7d 76
public.profiles     28d new 264   7d 76
zone2.users         28d new 264   7d 76
paxio.profiles      28d new 264   7d 76
All 264. And auth.users new-in-28-days is also 264.
So let me ask: what guarantees that your per-app metrics actually differ per app? I had never checked.
One trigger was creating a profile in every app
There was a trigger on auth.users.
CREATE TRIGGER on_auth_user_created AFTER INSERT ON auth.users
  FOR EACH ROW EXECUTE FUNCTION handle_new_user_multiapp();
Exactly what the name says. Whoever signs up in any app gets a profile row in every app schema. App A's new user is simultaneously counted as a "new user" of apps B through T. Counting per-app users from this table is always counting fleet-wide signups.
The twist isn't that the number was wrong. It's that I had already made a decision on it.
Six days earlier I wrote this down: "Of the map app's 248 new users in 28 days, 29 (11.7%) have ever completed a walk — 88% of new users vanish without walking once." Then I used that 88% to conclude that "monetization is pointless when 88% leak before intent to pay." The direction of the conclusion survived, but the denominator was fleet-wide signups, not that app's. The magnitude has to be recomputed. I've been through this exact kind of restatement once before → I judged two months on numbers inflated 3×.
The behavior side reads like this:
people who have ever walked   54 all-time
walk users, last 28 days      40
last 7 days                   18
Only after seeing 54 did I know what size this app actually is.
Why it hid for months
Totals differ per schema (618 / 596 / 550 / 530…) — traces of the trigger being added mid-life and some rows being deleted. So looking at totals, every schema shows a different number and the fan-out is invisible. Only when you slice a recent window do they all collapse to the same value.
Which one do you look at? Cumulative totals, or the last 28 days? For months I only looked at totals, and totals were covering for the fan-out.
How to catch it
Slice a recent window instead of totals.
select t.table_schema||'.'||t.table_name,
       (xpath('/row/c/text()', query_to_xml(
          format('select count(*) c from %I.%I where created_at > now() - interval ''28 days''',
                 t.table_schema, t.table_name), false, true, '')))[1]::text::bigint
from information_schema.tables t
where t.table_name ~ 'user|profile' and t.table_type='BASE TABLE';
If identical values come out in a row, go look at the triggers.
select tgname, pg_get_triggerdef(t.oid)
from pg_trigger t join pg_class c on c.oid=t.tgrelid
join pg_namespace n on n.oid=c.relnamespace
where n.nspname='auth' and c.relname='users' and not t.tgisinternal;
The replacement metric — behavior, not profiles
The tool now auto-discovers only tables that have both an actor column and a timestamp column, and counts distinct actors per schema. Profile/user tables, ai_cache, *_counters, cron outputs, and server-generated insight/report/summary tables are excluded by name. A row the server wrote on a user's behalf is not evidence that the person opened the app at that moment.
Result (distinct actors, 28 days):
unreleased app 115 (all QA/seed) · map app 43 · lyrics analysis 14 · heart-rate app 8
symptom log 5 · gut health 4 · PCOS 4 · skin 4
and three apps at 0 for the full 90 days
Three apps have had nobody leave a trace on the server in 90 days.
One more thing — some apps are absent from this table entirely. They're local-only, with no server schema. That's not zero, that's "unknown," and I made the tool print that sentence explicitly. Put zero and unmeasured in the same cell and the next person gets it wrong too.
Three things to check right now
- Print per-app (or per-tenant) user counts sliced to the last 28 days, side by side. If two lines match, stop there.
- List every trigger on
auth.usersor your equivalent shared account table. If a name containsmultiapp,all, orfanout, suspect your metrics. - Does the table you count "active users" from contain server-written rows? If cron made the row, that's not activity.
The honest part
I counted per-app metrics from this table for months. In that time my gut sense of "this app has some users" was itself contaminated. I confirmed one wrong decision; I did not audit whether other decisions used the same denominator.
And the fan-out isn't a bug. The account is shared, so having a profile ready in whichever app you enter is correct. The mistake was reading it as a user metric. So I only fixed the tool. The trigger stays.
Recounted per app after that denominator was cleaned up: the 113-day, 42-app ledger.
Pick one row of per-app numbers on your dashboard. When did you last confirm that those numbers are different from each other?