A usage warning landed: 3 of my 4 included function-CPU hours were gone, and at 100% all 49 projects would be paused.
That made no sense. Almost everything I ship is static pages, and traffic is thin. How does a static site burn three hours of CPU?
Before the story, one question for you. That "static" site of yours — is it actually static? Not when you checked last week. Right now.
The wrong diagnosis first
The free plan blocks the usage API, so I started with what I could see from outside: I swept the response headers of all 49 sites.
Two things stood out. Four apps returned private, no-cache, no-store on their homepage, and three hand-written OG image routes kept missing cache even when I requested the exact same URL three times in a row. Each miss redrew the image — up to 2.4 seconds of work per request.
I thought I had the culprit. I added cache headers, deployed, and confirmed miss turning into hit.
Then I opened the dashboard.
devlog      1h 30m   46.1%
mbti           6m 4s    3.1%
zodiac         2m 45s   1.4%
naming         2m 7s    1.1%
The apps I had blamed weren't on the list at all. The thing eating 46% of the team's CPU for 30 days was this blog — the devlog you're reading right now.
Half of this job's lesson lives in that gap. Response headers tell you whether a structure is expensive. The dashboard tells you how much you actually spent. I looked at the first and assumed I knew the second. Expensive structure times zero traffic is zero dollars. However bad the shape, no visitors means no bill. That's the exact question I keep asking in analyzing from first principles, and this time I skipped it.
The real cause was one line
Inside devlog, all 239 URLs in the sitemap were no-store. A static blog, re-rendering every single page on every single request.
Here is the cause.
// app/layout.tsx
const requestLocale = (await headers()).get("x-devlog-locale");
It served two purposes: the <html lang> attribute and the wording of the "skip to content" link. That's it. One line to switch them between Korean and English.
But reading a request header even once in the root layout turns every route beneath it dynamic. The root layout wraps every page, so nothing is left that can be built ahead of time.
The evidence was sitting in the response headers.
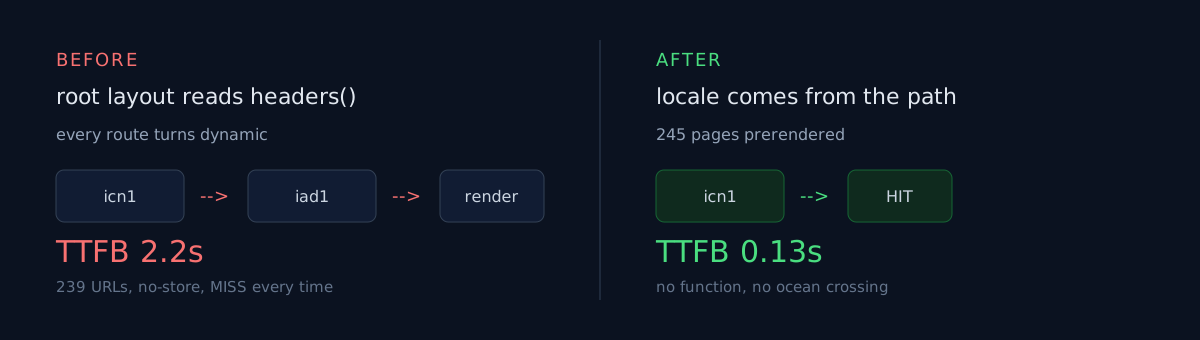
x-vercel-id: icn1::iad1::9htj5-1786930...Two regions. icn1 is Seoul, iad1 is US East. The request arrived in Seoul, flew to Virginia to be rendered, and flew back. Measured from Seoul, time to first byte was 2.2 seconds. Static pages end at icn1 and answer in 0.05 seconds.
The dates lined up too. That line came in on August 8, during an i18n pass that fixed the document lang. In the usage chart, the devlog bar starts climbing on August 8–9.
One line had been quietly writing an invoice for ten days.
Where would you have fixed it?
There were three roads.
One: move the function region to Seoul. No ocean crossing, but still a render per request. Two: bolt on cache headers and let the CDN absorb it. The dynamic render stays, and it goes slow again whenever the cache evicts. Three: delete the line.
I took the third, for a simple reason. The locale was already in the URL. /ko/posts/..., /en/posts/... — the first path segment is the locale, and I was asking for it again through a header. The proxy injected it, the layout read it, and the price was giving up prerendering for 245 pages.
The fix
The root layout no longer reads the request; <html lang> is pinned to the default locale. Everything locale-dependent moved down into app/[locale]/layout.tsx, which receives the locale as params and therefore needs no request access. The skip link moved there too, plus a short script that corrects the document lang only for non-default locales.
I also removed the header injection from the proxy and left a comment in its place: put this back and you kill 245 prerendered pages.
The build flipped to 245 SSG prerendered, and after deploying I measured again from Seoul.
| Before | After | |
|---|---|---|
/ko first byte |
2.14–2.24s | 0.12–0.14s |
| post page | 0.32–0.38s | 0.12–0.14s |
| path taken | icn1::iad1 |
icn1 |
Sixteen times faster. And this isn't a billing number — it's time an actual reader waits. A blog that took two seconds after a click now appears immediately. The 46% cost cut is the side effect.
Two gotchas I picked up on the way
Custom OG routes get no caching. OG images built with the file convention (opengraph-image.tsx) get a hashed URL and ship as immutable, so they render once per deploy. A hand-written app/og/route.tsx defaults to max-age=0, must-revalidate and redraws for every request, including every crawler that touches the page. You have to pass the header into ImageResponse yourself.
Returning an array from rewrites() can silently do nothing. An array is treated as afterFiles, so a real static route wins first. I wanted /?lang=en to serve the English page; after deploying, it served Korean. Switching to { beforeFiles: [...] } fixed it. Had I not re-read the live response, it would have shipped broken — same lesson as the site that kept showing an old version. Deploying isn't the end; it's the start of verification.
Three checks you can run in the next three minutes
- Request the same URL twice.
curl -sSI https://your.site/ | grep -i x-vercel-cache, twice. TwoMISSmeans that page renders on every request. - Count the regions in
x-vercel-id. Two, likeicn1::iad1, means the request went all the way to a function. One means it ended at the edge. - Grep your root layout.
grep -n "headers()\|cookies()" app/layout.tsx. If anything matches, that app has no static pages.
The honest part
I don't yet know whether the bill actually dropped. The free plan blocks the usage API, so it takes a few days of watching the dashboard. What's confirmed so far is response time and prerender count — nothing about money.
And half of this post is a record of being wrong. Lacking a measurement tool, I named a culprit by inference, fixed three innocent apps, and only then saw the real one. Those three were worth fixing, but they were a few percent of the problem. When you don't have the instrument, writing down "I don't know" beats pretending with the instrument you do have.
Your project may be carrying a line like this. Two curl calls will tell you in three minutes. Run them, and if the answer surprises you, I'd like to hear it.