I have 43 apps on the App Store and I kept tuning ASO — work that grows impressions.
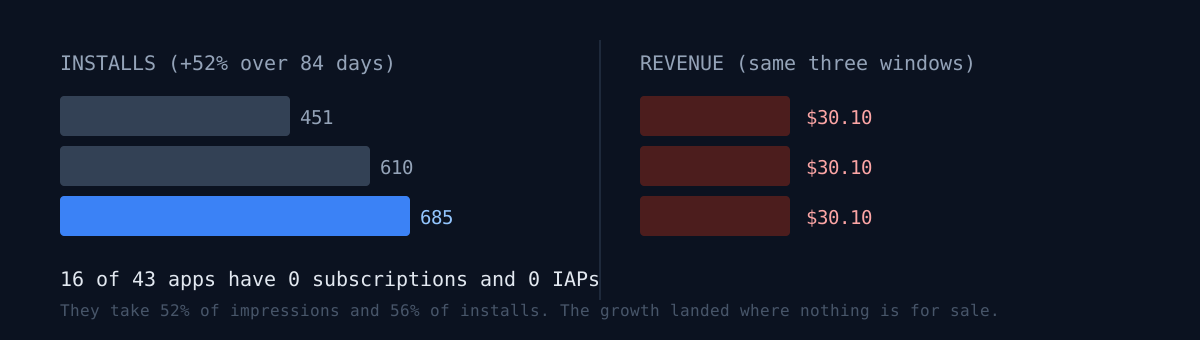
Impressions did grow. Cut into three 28-day windows, new installs moved like this:
d-84…-57   451
d-56…-29   610
last 28d   685      +52%
52% growth over 84 days. Revenue over the same period:
$30.10 → $30.10Not one cent.
This is the sequel to My top-impression app earned zero. That post was the observation. This one is the mechanism.
Exactly one term in the chain was broken
Window: 2026-07-07 to 08-03, 28 days.
impressions 51,744 → product page views 3,428 (6.6%) → installs 663 (19.3%) → 4 actual charges → $30.10The first three terms are all in normal range. 6.6% impression-to-view and 19.3% view-to-install need no fixing. The broken term is install → payment at 0.60%, plus the raw impression volume in front of it (44 per app per day).
What I checked next was the answer. I queried ASC directly for how many subscriptions and IAPs each app actually has.
16 of 43 have 0 subscriptions and 0 IAPs
those 16 take 52% of impressions (26,690) and 56% of installs (370)
The growth went to apps with nothing to sell. And those happen to convert best.
| App with no products | Impressions | Installs | View→install |
|---|---|---|---|
| map app | 9,499 | 85 | 8.0% |
| music quiz | 4,235 | 95 | 34.4% |
| nonogram | 1,966 | 67 | 60.9% |
| CCTV | 1,130 | 30 | 41.7% |
| coffee timer | 1,018 | 23 | 25.0% |
| minesweeper | 911 | 6 | 35.3% |
61% of people who view the nonogram page install it. It's the best-selling page in the fleet and it has nothing to sell.
The 36× gap is in revenue per install, not traffic
The fleet average is $0.045 per install. In the same window, one tinnitus tracker earned $24.5 on 12 installs — $2.04 per install. It sits around rank 20 by impressions.
The arithmetic forces the direction. To make $1,000/month on traffic at $0.045 per install I'd need 22,000 installs/month, 32× today. Pulling that from 1,848 impressions/day would require a 40% impression-to-install rate. Impossible.
I also re-checked my best measured ASO levers: icon redesign 3.09×, page rework 2.4×. Both move only the front terms. Even if every one landed, that's 2–3× revenue — about $90/month.
Where would you put next week? Push impressions harder, attach checkout to the apps that already have traffic, or first check whether those apps have any scale at all?
Money comes from the payout report, not analytics
SALES SUMMARY DAILY is the only ground truth. Analytics "subscription starts" over-counts because it includes free trials and intro pricing. And the Apple Identifier on IAP rows is a product ID, not an app, so it doesn't resolve to an app name — attribute via Title / Parent Identifier. There's a retention limit too: SALES DAILY goes back about 110 days, and older dates return 404.
Checking whether products exist is two calls.
GET /v1/apps/{id}/subscriptionGroups → /subscriptionGroups/{gid}/subscriptions
GET /v1/apps/{id}/inAppPurchasesV2
What I actually shipped — one line of JSON
Attaching products takes time, so I did the cheap thing first: I changed the destination of the cross-promo banner that ships inside 32 apps. Copy, link and art are fetched from remote JSON, so there's no build and no review.
Checking it, the banner was pointing at the homepage of an app that isn't released yet. My entire internal traffic inventory had been flowing somewhere you can't buy anything, for a week.
I repointed it at the app with proven payment ($2.04 per install). One line of JSON, live in five minutes.
{ "id": "quieta", "enabled": true,
  "url": "https://apps.apple.com/app/id6787811542",
  "exclude": ["quieta"] }
exclude stops an app promoting itself. I didn't delete the old promotion, just set enabled: false — when that app is approved, it comes back with a reorder.
I didn't make new banner art either. The App Store creative header (3840×1646) center-crops to the banner ratio; the icon, name and tagline sit in the middle so the crop is safe. 14KB per locale, five locales, done.
Three things to check right now
- How many subscriptions and IAPs do your top 5 apps by impressions have? Two API calls.
- Where does your internal cross-promo banner point today? Click it — do you land on something purchasable?
- Are you reading revenue from analytics events or from the payout report? If they disagree, discard the first one.
The honest part
It took building 43 apps to reach this conclusion. Only after the 43rd did I confirm numerically that growing impressions can leave revenue flat. And checking whether products exist was two API calls. I didn't look for months. I checked ASO metrics weekly and never once asked "can a user pay in this app?"
There's also no guarantee this post's prescription — attach products to the apps without them — is right. Converting well and being willing to pay are different things. The traffic leader, the map app, turns out to have 40 real users in 28 days by server data, so even an optimistic 5% paid conversion is roughly $30/year. Mixed into "nothing to sell" is a good number of "there was never any scale here."
Apps in this post: tinnitus tracker · map app · nonogram · music quiz · CCTV.
The same window stretched to the full 113 days, with every charge itemised, is in I shipped 42 apps in 113 days. Total revenue: $69.82 — the no-product count settled at 16.
Think of the app whose installs grew most this month. Does a screen exist in it where a user can hand you money?