I ran a script for months that pulls App Store Connect analytics via API and builds per-app funnels — impressions → product page views → installs → trials → payments — and used it to judge whether ASO work paid off.
Cross-checking against revenue for the first time, the numbers didn't line up. Payment counts in the sales report vs. payment events in the analytics report were off by 6×. The sales report is known to be accurate, so I dug into analytics.
Have you ever counted how many of your metrics have never been cross-checked against a second source? There's a class of bug that can't be found before you cross-check. This was one.
The report re-loads the prior 3 days every run
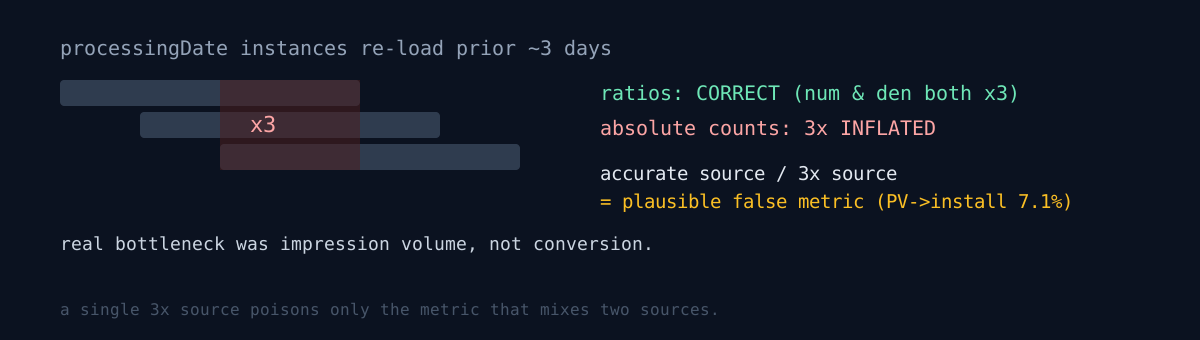
ASC's ONGOING analytics reports re-load roughly the prior 3 days on each processingDate. It's a restatement. A row for Date D appears three times, on processingDate D+1 through D+3.
engagement instance processingDate 07-11 → includes Date 07-09, 07-10
engagement instance processingDate 07-13 → includes Date 07-10, 07-11, 07-12
→ Date 07-10 appears in both instances
The script summed every instance. So it counted almost every date 2–3 times. Measured multiplier: 2.76–3.01×.
The real twist: the ratios were fine
Up to here it's just a bug. The real twist is that the ratios weren't distorted at all.
Because numerator and denominator inflate by the same factor, PPV (impression→PV), inter-app rankings, and conversion rates were all correct. Even the pre/post multiplier verdicts from an ASO lever check weeks earlier held up. What broke was the absolute values — and the conclusions built on absolute values.
And that one thing was fatal. It's the moment you divide an accurate source by an inaccurate one.
- Install counts came from the sales report (accurate).
- PVs came from the analytics report (3×).
- PV→install = installs ÷ PV gave 7.1%.
For a metric whose normal range is around 20%, 7.1% is an obvious anomaly. So I diagnosed "PV→install is the fleet's biggest leak." The real value was 20.4% — perfectly normal.
When a single source is 3× off, the values computed within that source are fine, and only the values that mix two sources rot. And the mixed value is usually the most important metric. Verify within a single source and nothing looks wrong — which is why this bug lived so long.
The real bottleneck was elsewhere: impression volume. 43 apps combined got 1,735/day, 40 per app. The problem wasn't conversion; it was that there were no impressions — and the inflated numbers made it look like exactly the opposite.
The inflation, measured
| metric | inflated | real |
|---|---|---|
| Quieta 28-day impressions | 2,140 | 734 |
| fleet 28-day impressions | 144,232 | 48,590 |
| fleet 28-day PV | 9,218 | 3,190 |
| Biasly trial starts | 5 | 2 |
| fleet payment starts | 12 | 2 (+1 trial-convert, +1 renewal) |
The fix — add dedupe to asc_analytics_engagement.py:
dedupe_restated(instances, date_field, lo, hi)
# iterate processingDate ascending
# key = (row's date + all dimension columns)
# last value wins (later instance is the correction)
# exclude Counts / Unique Counts from the key
# subs use date_field="Event Date"
⚠️ days must be counted as unique dates, not instance count. Count instances and the daily average is 3× off again.
One-line verification: Quieta 28-day impressions of 734 means dedupe is applied. 2,140 means it isn't.
I judged two months on this bug
Plainly:
- I actually carried the conclusion for weeks. I put "improve PV→install" on the priority list and planned work in that direction. The direction itself was wrong.
- There was a second defect. The window-compare script cut windows by processingDate. Restatement leaks the window by up to 3 days. It now pulls instances generously and cuts by the row's Date. Prior verdicts that attributed a "step change on a specific date" could be off by up to 2 days. The multipliers hold, but the date attribution is less trustworthy.
- I can't call the fix done. The daily report is built on a different machine, and this repo is local-only with no remote, so code doesn't propagate automatically. Until I fix that copy, the daily report keeps emitting 3× values. I handed over the patch but haven't confirmed it's applied. This is a structural problem — the pipeline is split across two machines — not a code problem.
- Why I didn't catch it sooner: looking only at the analytics report, nothing was wrong. It was a bug that can't be found before cross-checking with another source, and I hadn't cross-checked in months.
The opposite story from the same day
This post is about fixing a metric that "looked fine but was actually 3× wrong." The same audit produced the exact opposite case — a metric looked broken, and not fixing it was the fix. One looked broken but was deliberate by design, so not fixing was right; this one looked fine but was 3× off, so it had to be fixed. A matched pair on when to trust a metric.
A 3-line self-check
- In a multi-source pipeline, be especially suspicious of a metric that divides two sources. One source being off by a factor silently rots only that metric.
- Ratios within a single source are immune to a scale error. That's exactly why verifying within the source never catches it. Cross-check against a different source.
- Before summing a time-series report, check whether it has a restatement structure where the same date appears more than once.
The honest part
What makes this bug scary is that the result was plausible. 7.1% looked like "a leak you could fix," so I actually went to fix it. The real bottleneck (impression volume) hid behind that illusion for two months.
Since then revenue numbers come only from settlement reports, never analytics — that recount is the 113-day payment ledger.
Follow-up (2026-08-18): the "ratios survive" conclusion above holds only while restatement is the sole defect. The same report had a second one, and its multiplier differed per app — so neither the ratios nor the rankings survived that one: The column said 28 days. It was summing 118.
Think of one metric on your dashboard built by dividing numbers from two systems. That numerator and denominator — do they come from the same source?