I have 40+ apps on the App Store and I kept tuning their ASO — keywords, icons, screenshots — always on the same assumption: more impressions means more revenue. Then on 2026-08-04 I saw actual money for the first time. Until then I had no tool to pull proceeds, so I was using analytics subscription events as a revenue proxy. That over-counts, because it includes trials and intro pricing.
Before that, ask yourself: what are you using as a revenue proxy right now? Has it ever been cross-checked against real money? Mine hadn't, for months.
Impressions and revenue were inversely correlated
The SALES SUMMARY DAILY report is the only ground truth for money. I wrote a script to attribute it per app and pulled 56 days — and the assumption flipped head over heels.
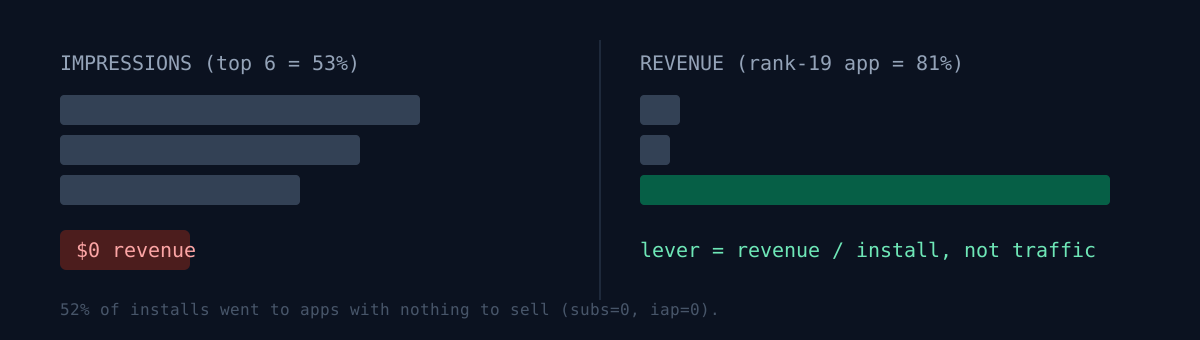
- The top 6 apps by impressions eat 53% of total impression inventory. Their 28-day revenue is $0.
- Meanwhile a single rank-19 app makes 81% of all revenue.
Worse was below that. 52% of all installs were going to apps with zero subscriptions and zero IAP. Half my visitors were being sent to stores with nothing to sell. I verified it per app in ASC (subs=0, iap=0).
Internal cross-promo had the same disease. The banners were working fine — one app got 872 referrer PVs over 28 days, proof it moves real traffic. But the destination was a zero-revenue app.
Do the arithmetic and the lever narrows to one
Current revenue per install is $0.046. To make $1,000/month on install volume alone I'd need 21,700 installs/month — 33× today. 33× via ASO is unreachable. The lever isn't traffic; it's revenue per install.
By revenue per install the gap is stark. The top-revenue app: $1.11 per install. The top-impression app: $0.00.
Let me stop and ask. What would you do? Bet your remaining time on pushing impressions 33×, or turn toward attaching monetization to the apps that already have traffic and nothing to sell?
The numbers (56-day actuals)
56 days (2026-06-08 to 08-02), developer proceeds ≈ $57.28 across 10 payments (≈$1.02/day). Narrow to 28 days (07-06 to 08-02): 3 payments, $30.10.
Per-app 56-day proceeds:
| App | proceeds |
|---|---|
| Quieta | $24.5 |
| Resolv | $16.6 |
| Flara | ₩9,600 |
| Zone2 | $7.0 |
| Aftershift | $2.1 |
| the other 38 apps | $0 |
Unit economics:
- $0.62 per 1,000 impressions
- $0.046 per install
- $0.0094 per PV
- 0.61% install → payment
There are also apps with high conversion but no impressions. The top PPV (impression→PV) apps all sit in impression rank 21–46 — Chunja at 12.8% (fleet #1, zero means to monetize), Aftershift at 8 installs → 3 paid, the #2 install→payment rate in the fleet, yet only 1,361 impressions. The apps that convert have no impressions; the apps with impressions have nothing to sell.
I wrote the tool fresh: asc_revenue_by_app.py --days N. The single line that took longest: the Apple Identifier on IAP/subscription rows is a product ID, not an app, so it doesn't resolve to an app name. You have to attribute via Title / Parent Identifier.
Two of the apps in this story:
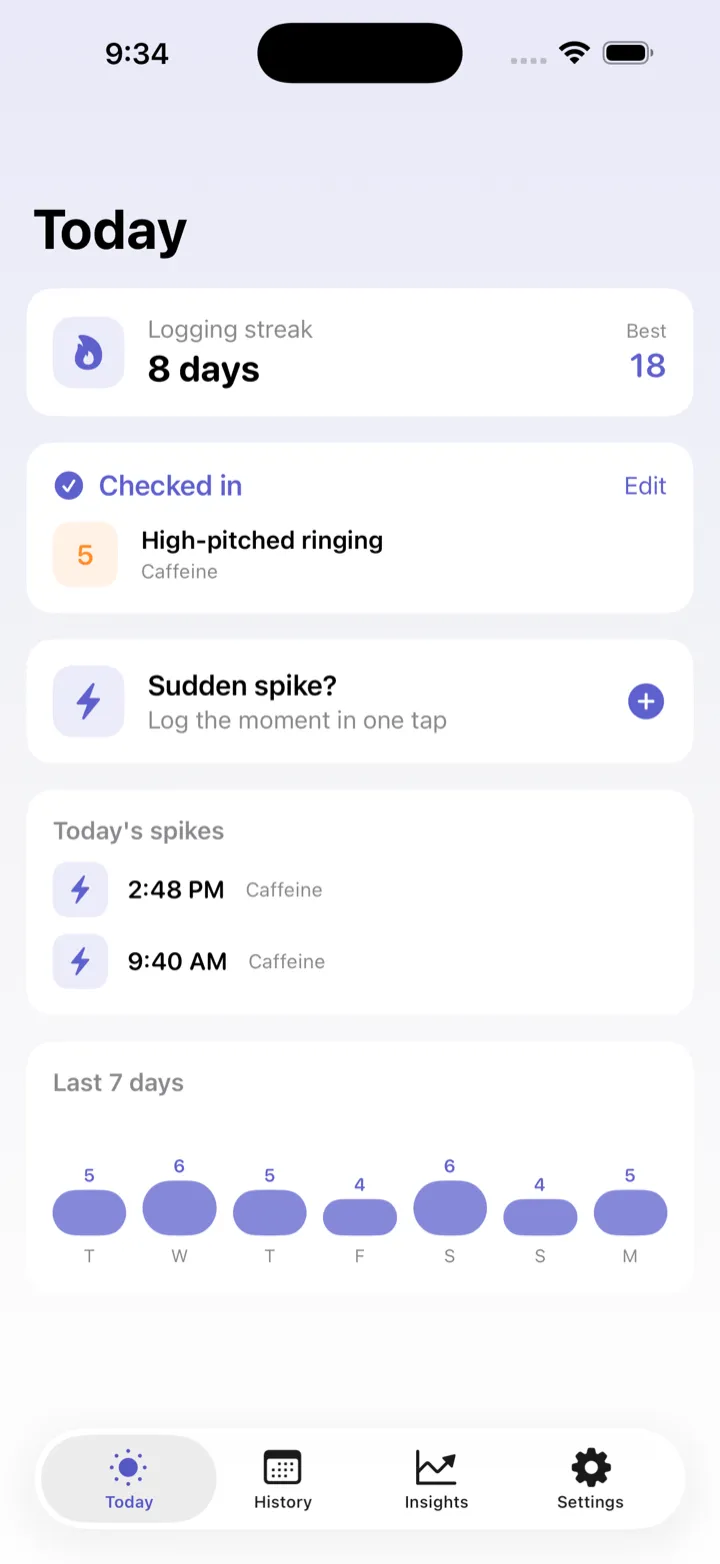
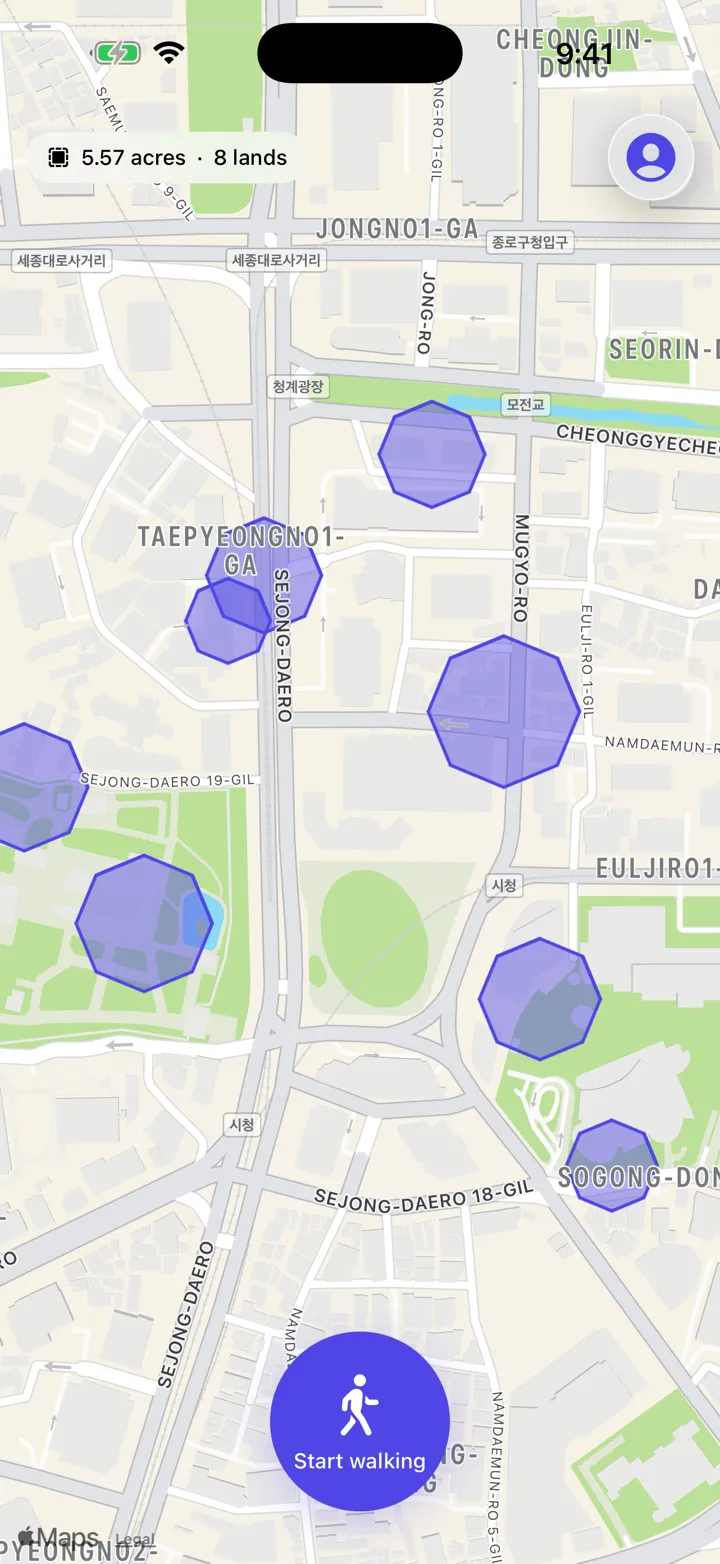
Featured apps: Quieta · Plotta · Resolv · Flara · Aftershift.
How much to trust this
The limits, stated plainly.
- The first version of this analysis was 3× inflated. It initially read impressions 144,232 / PV 9,218 and reached the opposite conclusion, "PV→install 7.1% is the biggest leak." Strip the double-counting in the ASC analytics report and it was impressions 48,590 / PV 3,190, PV→install 20.4% — normal. That story is split out → I judged two months on numbers inflated 3×.
- $57.28 over 56 days across 10 payments is statistically thin. Per-app rankings carry a lot of chance, and narrowing to 28 days is 3 payments, $30.10. I can push the claim to "revenue per install is the lever," but pushing it to per-app winners is overfitting. Why this sample can't support an A/B is here → I designed an experiment; it was statistically impossible.
- Some churn is a bug, not the product. An entitlement-ID mismatch left users "paid but Pro not enabled", and the fix shipped over the analysis window. Don't read that window's churn as user attrition.
- FX is a static rate, so the USD column is a ranking approximation.
The honest part
For months I was pushing the wrong side of the lever. Growing impressions is visible and tangible, so you keep doing it. But the real bottleneck was "is there anything to sell once traffic arrives," and that stayed invisible until I pulled actual proceeds and cross-checked — not the dashboard.
All 14 charges pulled from settlement reports, with per-app proceeds, are laid out in the 113-day ledger post.
Think of one app that's top-of-fleet by impressions. Would you check what it actually earned last month — from the real payout report, not a proxy?