Apple opened a new creative-asset spec for App Store search results and headers. The plan was common: attach the assets to my top-3 revenue apps, compare the funnel two weeks before and after, measure the effect. Make the assets, attach them, look at before/after.
Before executing, I ran the power calculation. The plan didn't hold.
The top-revenue apps had double-digit impressions
The top-revenue apps get 20–48 impressions a day. That sample cannot detect the effect in any realistic window.
For a 2-proportion z-test at 80% power, α=.05 two-sided, the days needed per window come out like this. Creative assets only render on iOS 27+, so effective impressions are impressions × iOS27 share, and I assumed 30% share.
| App | impr/day | +30% lift | +50% | +100% |
|---|---|---|---|---|
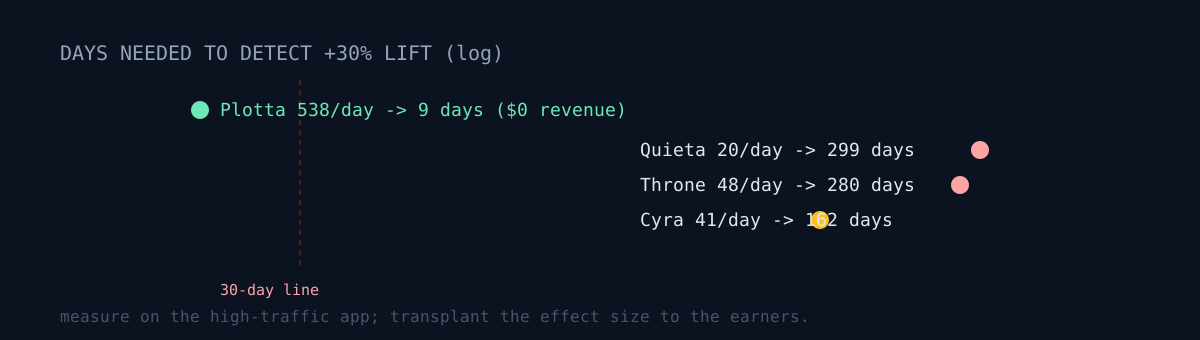
| Quieta | 20 | 299 days | 116 days | 34 days |
| Throne | 48 | 280 days | 109 days | 32 days |
| Cyra | 41 | 162 days | 63 days | 18 days |
| Plotta | 538 | 9 days | 3 days | <1 day |
| Heardle | 203 | 46 days | 18 days | 5 days |
The top-two revenue apps take over a month even at a +100% lift, and even that is buried in the noise of impressions themselves. Meanwhile one app that earns $0 (Plotta) gets 538 impressions/day, so it reads in days.
Split the measurement cohort from the revenue cohort
That flipped the conclusion. The app that measures the effect and the app that gets the effect must be different apps.
- Measurement = the high-impression app. It earns $0, but it's the only instrument that can size the lever.
- Revenue = the top-revenue apps. Attach the same assets, but make no "validated by the funnel" claim. Transplant the effect size measured on the instrument app.
It's counterintuitive. But the original plan — run an A/B on an app with double-digit impressions — was more counterintuitive. Here the zero-revenue app is the instrument, not the asset. Why those apps have so few impressions in the first place is here → my top-impression app earned zero.
Let me stop and ask. What would you do? Skip the math, attach to your top-3 earners, and get "no effect" two months later — when it's not that there's no effect but that you can't see it? Or split measurement and revenue across different apps?
Same-spec assets, wildly different time to a readable result. Left (Quieta) at 20 impressions/day = 299 days; right (Plotta) at 538/day = 9 days.
The second gotcha — capture the baseline now
ASC's ONGOING analytics reports have a daily-instance retention limit. On 2026-08-06, request the 28-day pre window (06-09 to 07-06) and only 8 days come back. The post window (07-07 to 08-03) of the same request is complete, 28/28. Daily data older than roughly 60 days is gone.
The creative assets open in the fall (Sept–Nov). Go to reconstruct a "before" baseline then and the data is already gone. There's no option but to capture it now and save it to a file.
This generalizes beyond assets. If you plan to measure something in the future, snapshot the baseline now, not at measurement time. Retention limits sit quietly on most analytics APIs, and by the time you need the data it's too late. So I put a weekly snapshot on launchd to capture it automatically.
Code / numbers
Baseline actuals (asc_funnel_window_compare.py, 14-day windows):
| app | Impr/d | PPV (Impr→PV) |
|---|---|---|
| Plotta | 538 | 12.0% |
| Reelo | 282 | 2.0% |
| Heardle | 203 | 6.6% |
| Itda | 149 | 3.9% |
| Throne | 48 | 4.7% |
| Cyra | 41 | 9.0% |
| Quieta | 20 | 9.9% |
Assets built:
release_tools/creative_assets.py build --app all
→ 140 images (header 3840×1646 / search 3840×2560, safe area 17–23% of area)
   Quieta·Throne·Cyra 18 locales + Plotta 16 locales
Baseline retention automation:
release_tools/asc_funnel_snapshot.py          # dated JSON + md
weekly launchd: com.ootssu.asc-funnel-snapshot (Mon 14:20, --if-older-than 7)
One gotcha: under launchd you must use the real interpreter path, not the pyenv shim.
Limits of this conclusion
- The original plan (before/after on the top-3 earners) is scrapped. Building the assets is valid; the measurement design never held.
- iOS 27 share of 30% is an assumption. I don't know the real number. Lower share means more days needed.
- Pre/post comparison is itself an inferior design — seasonality and impression drift leak straight in. Product page optimization (
appStoreVersionExperimentsV2) with concurrent traffic splitting is superior, and header assets are named as a supported test target. Whether search-result assets are covered has to be confirmed in the fall. Even the alternative I have now is second-best, not best. - The impressions here are the values after removing 3× double-counting. Had I run the power calc on the pre-dedupe numbers, I'd have been optimistic by 3× on the days needed and wrongly concluded the plan held.
The honest part
The lesson isn't "don't attach the assets." I made them and I'll attach them. The lesson is run the power calculation before executing. It takes 30 minutes; skip it and you get a false "no effect" months later — a conclusion produced not by absence of effect but by inability to see it.
Next time you plan an A/B, ask one thing before you build the assets: with this sample, can I see the effect size I'm after within a realistic window?