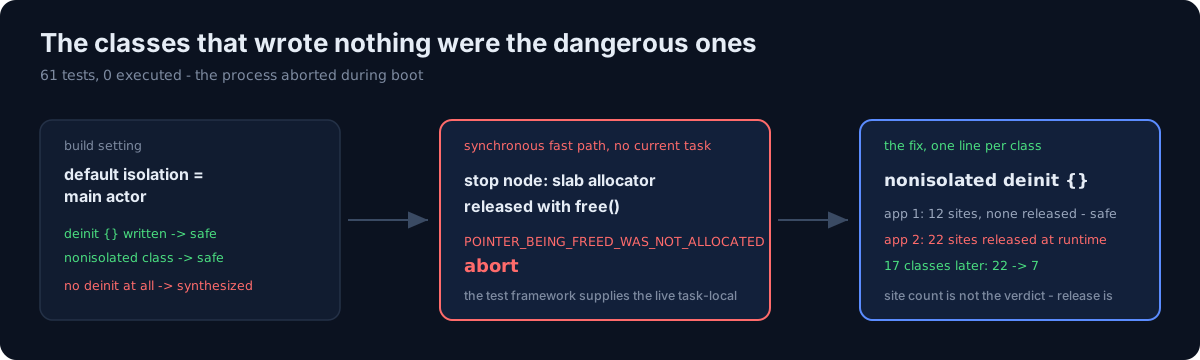
One iOS app's test suite died with SIGABRT during boot, so not one of its 61 tests ran.
At first it looked like a defect in a specific test, because the crash point moved between runs.
It wasn't an app code defect. It was a build setting plus a runtime defect.
One question first. When your tests die at a different point on every run, do you call that a flaky test and move on?
1. The stack
<ViewModel>.__deallocating_deinit
 → swift_task_deinitOnExecutorMainActorBackDeploy
 → swift_task_deinitOnExecutorImpl
 → TaskLocal::StopLookupScope::~StopLookupScope()
 → ___BUG_IN_CLIENT_OF_LIBMALLOC_POINTER_BEING_FREED_WAS_NOT_ALLOCATED
 → abort
The trigger is a single build setting: default actor isolation set to the main actor.
2. Only the classes that wrote nothing are dangerous
With that setting on, the compiler synthesizes an isolated deinit only for main-actor classes that do not write a deinit themselves.
| Class shape (default isolation = main actor) | isolated deinit synthesized |
|---|---|
| No deinit written (implicit) | yes |
Explicit deinit {} / nonisolated deinit {} |
no |
Explicit isolated deinit {} |
yes |
nonisolated class |
no |
Setting off (even with @MainActor) |
no |
This is backwards from intuition. You normally suspect the code someone wrote; here the danger is in the code nobody wrote. That is why reading the source never surfaces a culprit — the culprit is code that isn't there.
3. The mechanical cause
Confirmed by disassembling the runtime concurrency library.
When there is no current task, the runtime uses the thread fallback task-local list and allocates
the stop node from the task slab allocator — while the destructor releases it with free().
That violates malloc's invariants, so it aborts unconditionally.
Three conditions must hold:
- an isolated deinit runs on the synchronous fast path
- synchronous code with no current task
- a live binding in that thread's fallback task-local list
The test framework supplies ③. It installs an error-observation task-local per test method, and that frame is right there in the crash stack. So the rule becomes "every test that releases a main-actor object dies" — and because the release point differs per run, it masquerades as a defect in one specific test.
There's a 20-line minimal reproduction (bind a task-local with a synchronous withValue, release a
class with an implicit deinit inside it). Remove the setting and it doesn't crash. The same source
does not crash on a macOS host, and I could not determine why.
4. My first claim was unverified
⚠️ "All 61 pass" started out as an unverified claim.
What I had checked at that point was an object-code diff and ** TEST BUILD SUCCEEDED **. The
simulator was occupied by another workload, so I couldn't run the suite. I ran it a day later:
Executed 61 tests, with 0 failures, zero aborts in the log.
"The build succeeded" and "the tests pass" are different facts. Especially here, where the defect kills the process during boot and can never show up in a build. In the same batch, the test run that executed nothing and the timer that made every test pass are the other two — three ways a green light lies. The earlier posts in that family are every app passed, then every app failed and the fallback that kept the board green.
5. Traps I stepped in while diagnosing
- ⚠️ Turning off signing changes the symptom. Individual tests abort and some pass, so you misdiagnose it as "a defect in that test". You need signing on to get the real stack.
- ⚠️ The test result XML after a failed build is not evidence. Stale results are still there. In the same week I misdiagnosed a "locale-related failure" on another app through this exact trap.
- ⚠️ You will suspect isolation misuse first. It isn't that. Both app and tests can be main-actor.
- ⚠️ It isn't a deployment target difference either. The one thing that separates it is that setting.
Things that do not work: writing isolated deinit explicitly (it keeps the path and keeps
dying), raising the deployment target (no effect), a compiler flag to disable isolated deinit (does
not exist).
6. What would you fix?
- (a) Turn the build setting off
- (b) Add one line per affected class
- (c) Skip the tests
(a) looks fastest. Overriding it on the command line compiles with zero errors — the "hundreds of compile errors" in an older note of mine was simply not true.
But that app runs in a lower language mode with almost no concurrency diagnostics. Turn the setting off and types that were serialized onto the main actor become nonisolated without a single warning. So (a) compiles fine and silently changes isolation semantics.
The answer is (b).
7. The fix is one line
On classes the tests construct directly:
nonisolated deinit {}The body is empty, so behavior doesn't change — it just doesn't hop to the main actor on release, and view state objects are released on the main thread anyway. On one app, adding it to 4 view models took the object code's isolated deinit sites from 16 → 12.
8. Production risk is decided from the binary
An isolated deinit on an object that is never released never executes, so condition ① never holds. The verdict therefore isn't "how many sites" but "do the objects at those sites get released?"
otool -tV <app binary> | grep deinitOnExecutor | awk '{print $1}'   # call addresses
nm -n <DWARF binary inside the dSYM> | awk '$2=="t"||$2=="T"{print $1,$3}'
# binary-search the preceding symbol per address → demangle → owning class
⚠️ The app binary inside an IPA is fully stripped — one text symbol. You must attach symbols from the archive's dSYM.
The two apps came out differently.
- One app: no risk. All 12 sites were 9 singletons, a private-init singleton, the app delegate, and a resource bundle class that is never instantiated. Nothing gets released.
- The other app: real risk, live. 22 sites, different in nature — an environment object is swapped at runtime, releasing itself and the services it owns; 3 view models are view state; a sign-in delegate is released per sign-in; a camera coordinator per view. One line in 17 classes took it from 22 → 7 sites, measured on the archive binary.
9. Crash data could not confirm it
The store analytics report API does include crash reports (an older note of mine saying it doesn't was wrong). But in practice all 6 apps returned zero instances.
At our install volume it produces nothing, so 0 is not evidence of "no crashes". It is a zero with no denominator.
Split the procedure to stay under the 600-second wall:
xcrun simctl bootstatus <udid> -b
xcodebuild … build-for-testing
xcodebuild … test-without-building -parallel-testing-enabled NO
Three things to check in your own project
- Do your tests die at a different point each run? That points at a shared path, not at "that test". Read the bottom of the stack.
- Are you counting build success as tests passing? A defect that kills the process during boot never shows up in a build.
- Are you using zero crash reports as evidence of safety? At low install volume, zero means nothing.
The honest part
The longest part of this wasn't finding the cause — it was answering "so is production at risk?" I got as far as opening the binary and counting sites, and the site count turned out not to be the answer. The 12-site app is safe and the 22-site app is dangerous. The only difference is whether those objects are ever released.
Counting and judging risk are different jobs. I only learned that after the two apps came out on opposite sides.
Do one thing today. Run otool -tV | grep deinitOnExecutor against your archive binary. If
sites come back, the next question is whether those classes get released at runtime.