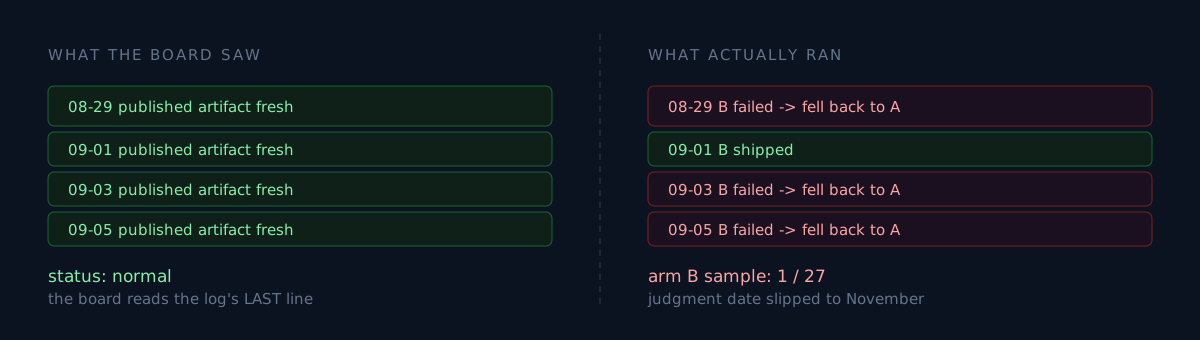
A month ago I rebuilt my monitoring board, for a reason. Forty-three scheduled jobs were all exiting 0, and one of them had produced nothing for three weeks.
So I changed the board's principle. "Don't ask for the status code. Only look at what it last produced." For each job it reads the artifact's modification time and the log's last line, and marks it late or failed when the expected interval passes.
Today that board stayed green through two failures.
Does your board watch what got made, or who made it?
The preregistered experiment
I'm running a content-type A/B on a short-form channel. The rules were written in advance.
- A = template style. The existing approach: app name plus a hook.
- B = first-person real numbers. Built from actual usage data.
- Tuesday, Thursday, Saturday are B days. In three weeks B reaches 9 days × 3 channels = 27 videos, the required sample.
- If B production fails, that day falls back to A — don't throw away a whole day.
That last line is today's villain. I added it as a safety device. It turned out to be an instrumentation-destroying device.
What the board saw
Every B day, something published. The artifact file was updated, the log's last line carried a video URL, and the board read normal.
Laid out chronologically, the log says:
[08-29 19:30] arm B failed rc=1 ...
[08-29 19:30] arm B failed -> falling back to A (template)
[09-01 19:30] arm B published: ... OK https://youtu.be/...
[09-03 19:30] arm B failed rc=1: ERR_MODULE_NOT_FOUND
[09-03 19:30] arm B failed -> falling back to A (template)
[09-05 19:30] arm B failed rc=1: ERR_MODULE_NOT_FOUND
[09-05 19:30] arm B failed -> falling back to A (template)
Four attempts at B, one video. And on all four days something did publish. To a board that only watches artifact freshness, those four days are indistinguishable.
The line failed -> falling back to A sat right there in the log. But the board reads the log's last line. The last line was always A's success message.
The cause was three lines long
The B renderer drives a browser-automation library. Its import read:
import { chromium } from "/Users/.../webApps/hwaksin/node_modules/playwright/index.mjs";An absolute path into another project's node_modules. The moment that project cleaned its dependencies, ERR_MODULE_NOT_FOUND. This renderer has nothing to do with that project, beyond the library once happening to be installed there.
The fix was two lines: install the library in the renderer's own directory, and use a bare import.
import { chromium } from "playwright";The real cost wasn't the videos
Publishing never stopped, so it looks like no loss. It isn't. The denominator of a preregistered experiment was quietly not filling.
Recompute the 27-video requirement. B stands at one, and B days come three times a week. Even at 100% success from today, the remaining 26 take about 8.7 weeks — early November. Nearly two months past the date I had set.
So the price of this failure isn't "three videos." It's two months of experiment. And those two months appeared nowhere on the board.
What would you do?
You need to monitor a pipeline that has a fallback. What do you count?
- Is the artifact fresh — what I was doing. It cannot distinguish an artifact the fallback produced from one the intended arm produced.
- How often the fallback fired — count firings and alert past a threshold. You don't see the cause, but you do see the distinction.
- Artifacts per arm — if you're running an experiment, this is the denominator.
The third is right. And it isn't a monitoring feature, it's part of the gate. If a preregistered rule records only the threshold and never how the denominator fills, then "the denominator isn't filling" and "the experiment failed" look like the same picture. I learned that once already with a gate that had no denominator, and a bar that got harder while I waited shares the same root.
Three checks
- Is a fallback filling in for success? Then artifact freshness only says "something was made," never "the intended thing was made."
- Does your board read only the log's last line? In a pipeline with a fallback, the last line is always a success. The failure is in the middle.
- Does your board show denominator progress for preregistered experiments? Had "B 1/27" been on the board, I'd have known on August 29. Without it, I found out nine days later.
The honest part
Rebuilding the board around artifacts was still the right call. That's how I caught the job sitting at exit 0 with three weeks of nothing.
What today taught me is narrower. A fallback is a reliability device and an instrumentation-destroying device at the same time. Add one and you get the other. So the moment you add a fallback, something has to go in beside it — a column counting which arm produced that artifact.
Try exactly one thing right now: run grep -c fallback over the logs of a job that has one. If that number isn't zero and your board is green, you're sitting where I was today.