I added a cross-promo banner to an app. It's a few dozen lines of SwiftUI that pulls copy and a link from remote JSON — the whole point being to change copy on the server without a build. And it never showed on TestFlight. It showed in the simulator.
One question first. If you add a log, a flag, or a temporary view to see a bug, and the symptom disappears the moment you add it — do you trust that diagnostic code? I did, and it cost me four hours.
The symptom betrays the diagnosis
With no clean way to read logs on device (a second gotcha, below), I built a "draw the failure reason on screen" diagnostic build. The result:
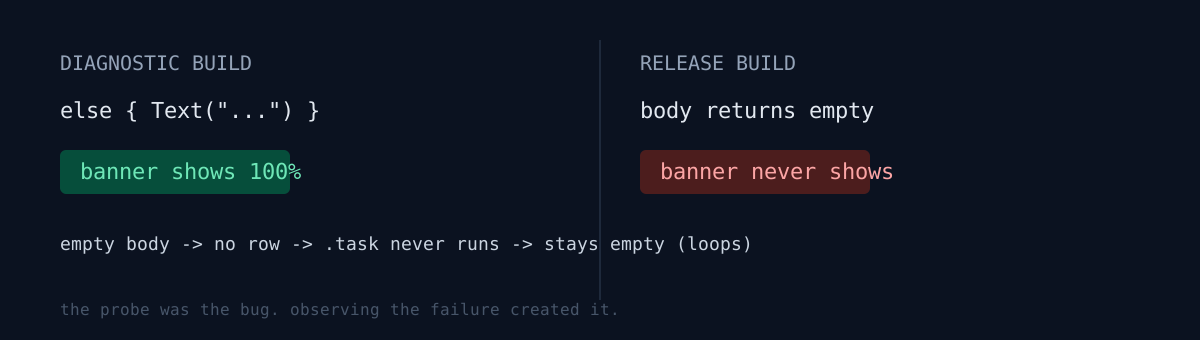
- Diagnostic build: banner shows 100% of the time
- Release build: banner shows 0% of the time
From there I suspected the environment. I swapped Debug ↔ Release, simulator ↔ device, dev signing ↔ App Store signing. None of it. Four hours, gone.
The evidence was there from the start. A variable that splits 100-to-0 is code, not environment. Environmental issues wobble probabilistically. A clean 100:0 means there's a single switch — and that switch was the diagnostic code I'd just added.
The culprit was one else
The view that draws the remote config looked like this:
// ❌ the load never starts on first entry
struct PromoBanner: View {
    @StateObject private var loader = Loader()
    var body: some View {
        Group {
            if let r = loader.resolved { Card(r) }   // nil at first
        }
        .task { await loader.load() }                // ← never runs
    }
}
// placed as: Form { Section { PromoBanner() } }
Inside a Section in a Form/List, if a view's body returns an empty result, SwiftUI never creates that row. No row means the .task attached to it never runs. But "not loaded yet" is "empty content," so first entry is always that state. The chain loops back on itself:
not loaded → body empty → no row →
.tasknever runs → never loaded
Add one diagnostic else { Text("...") } and the body is no longer empty. The row gets created, .task runs, the banner shows. The instrument was changing what it measured. The diagnostic build succeeded 100% because the diagnostic code fixed the bug — and release, of course, didn't have that code.
The fix: start in init, idempotently
The key is to not make the load's start depend on the body's result. Section calls the view's init when it materializes children, so start there.
// ✅ init is called regardless of the body result
final class Loader: ObservableObject {          // @MainActor
    static let shared = Loader()
    private var started = false
    nonisolated func start() {                   // called from View init, so nonisolated
        Task { @MainActor in
            guard !started else { return }       // SwiftUI calls init many times → must be idempotent
            started = true
            await load()
        }
    }
}

struct PromoBanner: View {
    @ObservedObject private var loader = Loader.shared   // must outlive the view
    init() { Loader.shared.start() }
    var body: some View {
        Group { if let r = loader.resolved { Card(r) } }  // .task only as a safety net
    }
}
Two things are non-negotiable: the loader must outlive the view (hence shared), and because SwiftUI calls init repeatedly, start() must be idempotent.
The regression test cemented the wrong conclusion
Honestly: I wrote the regression test first, and it sent me wandering for another chunk of those four hours.
// ❌ a test that doesn't reproduce the production view hierarchy
let vc = UIHostingController(rootView: PromoBanner())   // mounted directly
Mount the view directly on a UIHostingController and the row is never empty, so .task runs fine. Seeing that pass, I concluded "Group + .task works even when the condition is false." Wrong. The test failed to reproduce the Form/List container the view actually lives in. The test has to sit in the same container as production.
// ✅ same container as where it actually lives
let vc = UIHostingController(rootView: Form { Section { PromoBanner() } })
let w = UIWindow(frame: ...); w.rootViewController = vc; w.makeKeyAndVisible()
// nil after 20s without the trigger; filled with it
And I removed the fix to watch the test fail first, then restored it. Had I only watched it pass, the test might have been catching nothing.
The attached second gotcha — on-device logs
The reason I drew diagnostics on screen at all is that there was no clean way to read logs on device.
xcrun devicectl device process launch --consoledoes not receiveNSLog/os_log. It only attaches stdout.log streamhas no--device-name. It's host-only.- Console.app works but is awkward to reach for a TestFlight build.
So I'd concluded that a "draw diagnostics on screen" throwaway build is the most reliable on-device diagnostic. That conclusion still holds. And this very bug was hidden for four hours by exactly that technique. The same trick was both the best tool and the worst trap.
The app the banner shipped in is Itda.

A 3-line self-check
- If the symptom disappears when you add a probe, make the probe your prime suspect — especially a probe that adds something to conditional rendering, because a new branch changes the layout tree.
- A variable that splits 100:0 is code, not environment. If it doesn't wobble, find the switch.
- Put regression tests in the same container as production. A view mounted directly on
UIHostingControllerdoesn't reproduce a productionForm/Section.
The honest part
The remote-config path didn't go as designed either. The intended URL was blocked by a Cloudflare challenge, so the working path is a .well-known/ fallback. Three nested traps in one banner — and the one that fooled me longest was the code I added myself.
If you're chasing an "it's the environment" bug right now, check one thing: does the symptom come back when you turn the diagnostics off?