I have a screen that watches 34 bots by their artifacts. It ignores exit codes — I've been burned by exit 0 lying — so it only asks what each bot last produced, and when.
That screen was showing three jobs as late. I opened them. All three were false.
Pick one alert on your dashboard and ask: is this a real failure, or a wrong threshold?
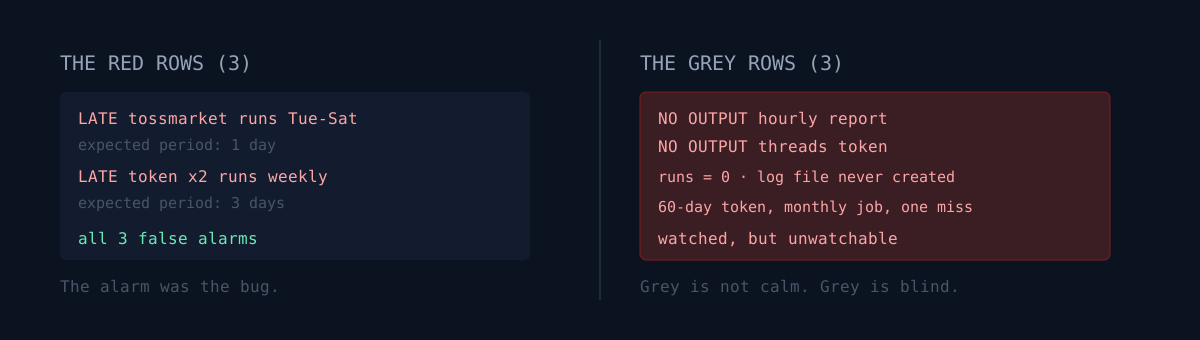
The three red rows
The first was a paper trading bot. Last artifact 1 day ago, expected period 1 day, therefore late.
I read the plist.
StartCalendarInterval:
  Weekday: 2,3,4,5,6    # Tue-Sat
  Hour: 8
It doesn't run on weekends. If Saturday 08:00 was the last run, then Sunday and Monday morning necessarily show a gap of more than a day. I had configured it to go red every weekend. The bot was fine.
The other two were token renewal jobs. Expected period 3 days, artifact 3 days ago, late. The plist said Weekday: 1 — once a week. Monitoring a weekly job on a three-day expectation means four straight days of red.
Three red lights, three healthy bots, one wrong dashboard.
So I diffed all 34
Stopping there just means a different false alarm next week. So I printed every job's dashboard period against its actual plist schedule — all 34, one to one.
Two more fell out. One runs only from 06:00 to 23:00 but had a 4-hour expected period; the overnight gap is 7 hours, so it was built to blink every night. Another was a Tue–Sat job set to 2 days.
And something more basic surfaced. The period is the maximum healthy gap. With zero slack, every job crosses a ratio of 1 right before its next run. Daily jobs blink daily; weekly jobs blink weekly.
# 25% slack: the period IS the max healthy gap, so the moment before the next
# run always lands at ratio ~1. Without slack, healthy jobs blink every cycle.
ratio = (time.time() - mtime) / (period * 1.25)
Five period values corrected plus 25% slack. Late count across 34 bots: zero.
Here's the fork — what would you do?
That was the whole request: "what are these three late jobs, can I ignore them?" Answer: all false, all fixed. I could have stopped.
But the same screen had three rows in another state. No output.
A. Move on. They're notify-only jobs; having no artifact is by design. B. Dig in. What sense does it make to watch something you have no way of seeing?
I picked B. That's where the real one was.
The grey cells were the real thing
One of the three was a social token renewal job. First of every month at 08:00, extending a long-lived token by 60 days.
$ launchctl print gui/501/com.***.refresh | grep runs
	runs = 0

$ ls logs/refresh.out.log
No such file or directory
It had never run. launchd creates the stdout file the instant it spawns the process. No file means no spawn. The Mac wasn't awake at 08:00 on August 1, and that session simply vanished.
The token lives 60 days. Miss the first of next month too and it expires with no renewal left — every automated post on that account stops. No error, no alert.
Running it by hand worked fine (extended ~60 days). The problem wasn't the code. The problem was a schedule where one miss equals expiry.
I moved it to weekly. Renewal is idempotent, so running it often costs nothing, and weekly means you'd need eight consecutive failures to get into trouble. Monthly means one.
To be watchable, a job has to leave a trace
The remaining grey row was a job that sends an hourly summary to Telegram. It writes no file, so it sits grey forever. If it dies, nobody finds out.
One line:
echo "$(date '+%Y-%m-%d %H:%M') heartbeat sent rc=$CODE ..." >> "$DIR/heartbeat.log"It records the fact of sending. Now the dashboard can measure that file's age.
Three things to check
- Does your dashboard's expected period match the real schedule? Weekday-only jobs, jobs that pause overnight, biweekly jobs. Diff them once, one to one. Five of my 34 were wrong.
- Is there slack in your alert threshold? Use the period itself as the threshold and healthy jobs blink at the end of every cycle. Repeat that enough and people start ignoring the alerts.
- Any rows showing "no artifact"? That isn't healthy — that's unwatchable. Either make it leave a trace or take it off the board. Leaving it grey tricks you into thinking you're watching something you can't see.
The honest part
Fixing three false alarms was worth very little on its own. The bots were healthy the whole time; I had just built the screen wrong.
What was worth something was opening the grey cells while I was in there. Red is loud — I'd have looked eventually. Grey is quiet, and if I hadn't opened it, I'd have found out on September 1 when the token expired, then spent half a day working out why posting stopped.
The real failure mode of alerting isn't silence. It's crying wolf often enough that people stop trusting the screen. Leave false alarms in place and they take the true signals next to them down with them.
Go find one item on your dashboard that has been sitting in a state that's neither healthy nor failed. That's probably your oldest unattended problem.