Six weeks ago I measured the whole fleet funnel. Yesterday I measured it the same way again. In between I shipped 3 new iOS apps and 12 Android ones, and filled a large number of empty store keyword slots.
| Aug 10 (43 apps) | Sep 15 (46 apps) | |
|---|---|---|
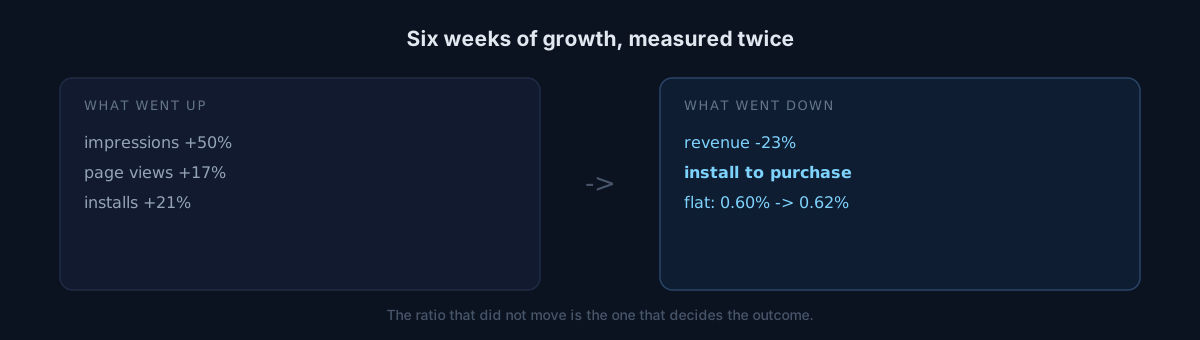
| Impressions | 51,744 | 77,680 (+50%) |
| Product page views | 3,428 | 4,024 (+17%) |
| Installs | 663 | 803 (+21%) |
| Revenue | $30.10 | $23.12 (−23%) |
| Install → purchase | 0.60% | 0.62% |
Half again as much reach, and less money.
How many of your growth metrics move in the same direction as revenue?
What I got wrong first
Before building that table I concluded that "PPV halved across the fleet." Nearly every app in the per-app pre/post comparison was down.
Summed properly it went 6.4% → 5.3%. A gentle decline — and over the same window impressions and page views both roughly doubled. Reading fleet direction from per-app window comparisons inverts the sign. That table literally carries a warning that it is "sensitive to window boundaries," and I walked into it anyway.
And my earlier diagnosis was disproved
From the August measurement I concluded: "apps with no products at all are eating 52% of the traffic." Several of the highest-traffic apps had nothing to sell, and that looked like the bottleneck.
Acting on it, I attached products to four apps on September 1st. Approved, live.
The result: all four made $0 over 28 days, and fleet revenue went down.
The constraint was never product availability. Install-to-purchase reads 0.60% and 0.62% at the two measurements — effectively identical. Until that ratio moves, nothing upstream reaches revenue.
A fork in the road
Pull each lever to its maximum and the arithmetic looks like this:
- View → install from 20% to 30% (industry-typical) → $35/month
- Purchase conversion from 0.6% to 2% (3×) → $74/month
- Both → $111/month
Every conversion optimisation succeeding still does not clear $100 a month.
Ten times the traffic instead? $230/month. You would achieve a 10× and the number would still be meaningless.
Where would you spend your time?
There was no channel I control
I split page views by source: search 54%, browse 20%, app referrer 12%, unavailable 11%, web referrer 3.7%.
Five page views a day arrive from the web. Everything I have built on the site side comes to that.
On the app-referrer side, exactly one single source cleared the privacy threshold in the detailed report: 19 views from a conversational AI app. Traffic that appeared without me doing anything, while my own cross-promotion banners between my own apps cleared the threshold zero times.
Android shows the same thing directly. For my highest-traffic app, the complete list of search terms is plotta (3) and "no search terms specified" (8). Only people who already know the name find it.
Self-check
- Have you put last quarter's growth metrics and revenue in the same table?
- Did you verify that actions taken on a previous diagnosis moved in the predicted direction — or did you stop at having shipped them?
- What share of your acquisition comes through a channel you actually control?
The honest part
This is not a brag. I run 74 apps, monthly revenue is $23, and six weeks of work did not move that number.
The more uncomfortable part: in one app's plan I wrote a kill criterion myself — "if install-to-purchase is under 0.6%, shut it down at eight weeks." The fleet average is exactly 0.62%. Apply the standard I set for one app to all of them and every one sits on the line.
I wrote about top impressions and zero revenue months ago. What I observed then has the same shape now, and in between all I did was grow the denominator.
Pick your most recent growth initiative and check what it did to the revenue column. It took me six weeks to run that check.