I was building a six-second vertical animation on a canvas. A map fades in, the territory you walked fills up, the numbers count, a card lands at the end.
I finished the code, opened the page with browser automation, and took a screenshot. Blank.
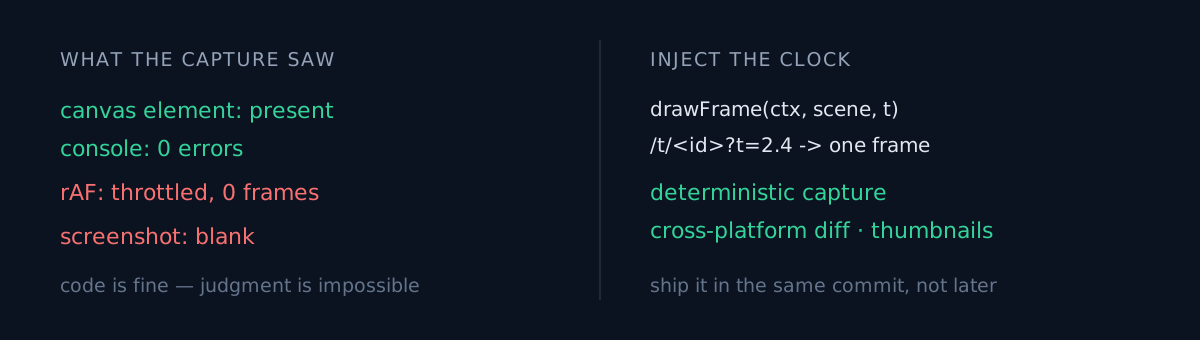
No errors. Every element present. The canvas element sat in the DOM at exactly the right size. Nothing had been painted on it.
The throttle is a spec, not a bug
The cause fits in one line. requestAnimationFrame is tied to tab visibility. When the tab is in the background the browser throttles the callback or stops calling it entirely. It is designed that way to save battery.
And an automated screenshot tool does not foreground the tab. It opens the page and bakes the render tree into an image. Nobody is looking at that tab.
Put those two facts together and you get this: the animation is implemented correctly, rAF never fires, not even the first frame paints, and the capture records an empty canvas. The code is fine and judgment is impossible.
That is what makes it different from an ordinary bug. Normally you fix the thing that does not work. Here, the means of seeing whether it works is gone. Every design question — are the colours right, does the timing drag, does the text cross the safe area — loses its evidence.
What would you do
There are a few options.
Look at it yourself. It works. It also means a human every time a frame changes, eyeballing two platforms side by side, and scrubbing back and forth to catch one moment inside six seconds.
Force the tab to the foreground. Some tooling can. Now your capture pipeline depends on window management, and it breaks again in CI or headless.
Replace rAF with a timer. You dodge the throttle and make playback worse. That trades product quality for review convenience.
I picked a fourth.
Inject the clock from outside
I pulled the animation out as a pure function.
export function drawFrame(ctx: Ctx2D, scene: ReelScene, t: number): voidt is a time in seconds. The function never reads a clock. It holds no state. Give it t and it paints that instant. Playback becomes a thin shell whose only job is to feed t forward from rAF.
Then I opened one query parameter on the share page.
// ?t=<seconds> freezes one frame — a review aid.
const freezeAt = t !== undefined && Number.isFinite(Number(t)) ? Number(t) : undefined;
Now /t/<id>?t=2.4 paints one frame at 2.4 seconds and stops. It does not matter whether rAF runs. It is not used.
That brought automated capture back. The side effects turned out to be worth more.
- Deterministic comparison — the same
tis always the same image. Change a palette, put before and after next to each other. - Cross-platform diffing — compare iOS and Android at the same
t, pixel by pixel. It catches differences the eye does not. - Thumbnails — once you know which second looks best, that frame is your share image.
- Regression tests — you can assert that at a given
tthe text stays inside the safe area.
The cost was one function signature and two lines of query parsing. If you have already carved things into drawFrame(ctx, scene, t), the frozen path really is a few lines.
The ordering is the whole point
Bolting this on later is expensive. If the animation code carries its own clock inside the rAF callback — an elapsed += delta hiding in a closure — extracting a pure function becomes a refactor.
Take time as an argument from the start and it is free. So this is less a debugging trick than a design rule: when you build a canvas animation, ship the single-frame path in the same commit.
I wrote about this same screen once before in The Console Was Silent and the Screen Was Blank. Back then I put rAF throttling on the suspect list and took it off, reasoning that it could not explain why even the first frame was missing. That call was right for that incident — the real cause was that hydration never happened at all. But the rAF throttle was also true at the same time, and it was still there after I fixed hydration. Finding one cause does not remove the other.
Three things to check in your own project
- Does your animation code count time, or receive it? If
elapsed += deltalives in a closure, that animation can only ever be reviewed by a human eye. - Can you reproduce a single frame of your animation from one URL? If not, you have no regression test, no cross-platform diff, and no automatic thumbnail selection.
- Are you assuming your capture tool foregrounds the tab? Most do not. If you captured an empty canvas, suspect this before you suspect your code.
The honest part
I did not add this by design. I added it because I was stuck. I finished the animation, the capture came back blank, and I spent a long while suspecting my own code before realising the problem was that I had no way to look.
It also did not solve everything. The OG card used in link previews cannot run canvas — there is no browser canvas inside an image generator. So that path reuses the same camera maths and redraws the territory as an SVG path instead. I assumed I could just reuse a frozen frame; I could not, and the fix was to share the camera so the shapes cannot disagree. A preview that shows a different shape than the video is worse than no preview.
Is there something moving on your screen right now that you cannot stop and look at?