I had already written down what to do after a win
When I pre-registered a content-type experiment for my shorts, I wrote one line about what came next: "Expand to all apps after PASS." The official verdict was due October 8. A check on October 5 showed the PASS was already locked in, because the remaining samples could no longer flip the result.
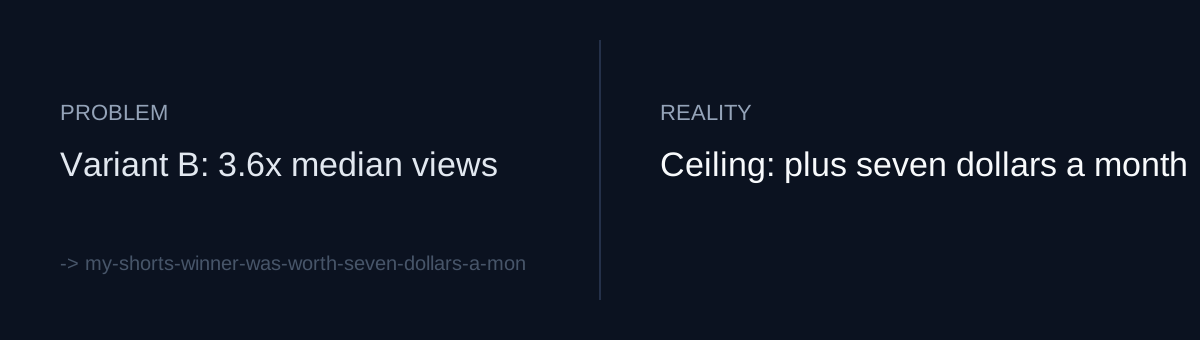
The numbers looked good. Average views in the first 7 days after posting were 81.5 for variant A (n=59) and 298.8 for variant B (n=21). The median ratio was 3.6x. Following the pre-registration, the next step was rolling B out to other apps.
But the pre-registration never asked how big a win had to be before expanding was worth it. It asked whether B won. It never asked what a win would be worth.
Does your experiment plan have a line for the most you could gain if you win, written in money or users?
One thing about the order of events: I ran the numbers below after the PASS was locked in. The expansion decision rests on this sizing, not on the verdict.
Views could be measured
- Three download-focused shorts channels, 30 days (09-05 to 10-04): 10,736 views (ko 3,108 · en 3,173 · ja 4,455)
- Net subscribers over the same period: +1
- If every video switched to B, the view ceiling would be about 10.7k × 3.7 ≈ +29k per month
That ceiling comes with a caveat. B's effect had been confirmed only on one app's territory reels. Nothing showed that other apps would also see 3.6x.
Installs could not be measured
First-time iOS installs over the last 30 days came to 1,817 across 64 apps:
- App Store search 1,301 (72%)
- App referrer 246 · Browse 180 · Web referrer 54 · Unknown 36
Installs from shorts are mixed into the app and web referrer buckets, and I had no way to separate them. Three things blocked me:
- YouTube leaves no referrer when someone clicks a profile link. My host's access stats (awstats) showed zero youtube referrers for August through October. Over the same months, Threads showed 174 and Facebook showed 104.
- The detailed report with the campaign column applies a privacy threshold. Only 20 of the 1,817 installs survive it, so the campaign token on my link could not be attributed.
- The /apps page, where the shorts profile link points, had no analytics tag. I couldn't even see whether anyone clicked.
So I took the most generous ceiling
I couldn't get an exact number, so I computed a ceiling using the assumption most favorable to shorts.
- Assumption: all 90 web-referrer and unknown installs came from shorts
- That gives a view-to-install rate of 0.84%
- +29k views a month would then mean +243 installs a month
- 30-day portfolio revenue of about USD 54 divided by installs is roughly $0.03 per install
- Result: +$7 a month at most. Using the 0.39% paid-start conversion rate instead, that's +0.9 paid starts a month
The real number is smaller. Threads accounts for most of the site's referrers, and YouTube shows zero. So shorts can only account for part of those 90 installs. My realistic estimate is +$1–2 a month.
Each app has its own cost
Variant B shows the app's real numbers on screen, so every app needs its own pipeline to capture those numbers. Wiring up a reel script and a web render for the first app took more than a day. Each of the three candidate apps would take several days.
The current B is also losing strength over time. The upper limit of the territory band it shows had dropped from 9.99 km² to 8.28 km².
What would you do: drop a format that wins 3.6x because its ceiling is +$7 a month, or expand it anyway?
What I decided
- No expansion to other apps. Spending several days per app for a +$7 ceiling and a realistic +$1–2 doesn't add up.
- The existing B stays as it is. It posts automatically on Tuesday, Thursday and Saturday at no extra cost. When the band runs out, the generator stops on its own with "no territory left."
- 72% of installs come from App Store search. That makes search placement the lever that pays, not shorts. Verdicts for custom product pages and in-app events (due November 3) were missing from my verdict schedule, so I added them on October 6.
- I added an analytics tag to /apps. It went out at 2 a.m. on October 6, after I kept a server backup and confirmed the md5 matched. Clicks on the shorts profile links (ko to
/apps/, en and ja via?lang=) now show up as sessions.
I also set a condition for revisiting this. If the ?lang=ja landing, which only the ja shorts use, gets double-digit sessions over 28 days, then the path from shorts to the site is alive. At that point I'll replace the ceiling above with measured numbers.
Self-check
- Does your experiment plan say what you'll do on a PASS, but leave blank the most a PASS could earn?
- Is there a step between your win metric (views) and money (clicks, installs, payments) that isn't measured at all?
- Are you spending your next block of work on a win in a minor channel while one channel brings in most of your traffic?
The honest part
The +$7 isn't a measurement. It's a ceiling I calculated using the assumption most favorable to shorts. I still don't know how many installs shorts actually drove. YouTube leaves no referrer and the detailed report hits a privacy threshold, so I won't know until the /apps tag collects 28 days of data. The $0.03 per install is also a portfolio-wide average. I haven't checked whether people who arrive from shorts pay differently. And I'm leaving the order on the record: I did this math after the PASS was locked in. Starting with the next experiment, I plan to do it at pre-registration.