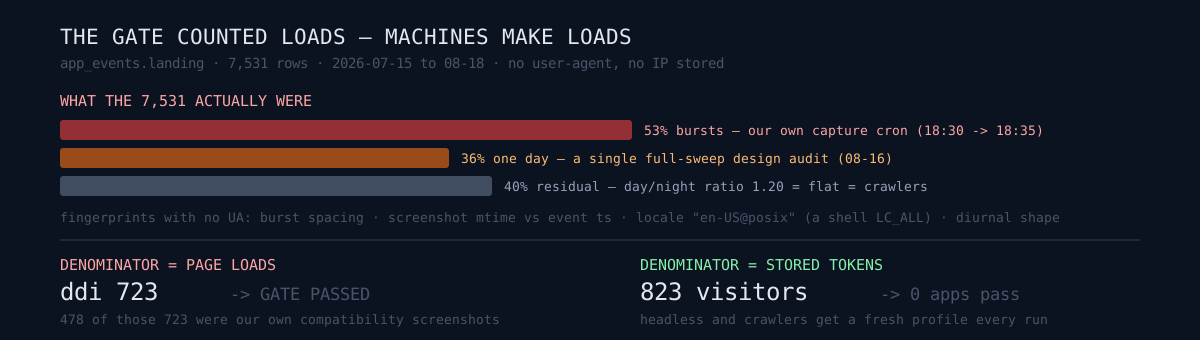
I put three dashboards side by side and something did not add up.
- Search report: 45 clicks over 28 days
- Bandwidth check: 1.3% of the free tier
- App analytics dashboard: 7,531 page views
Two of them said "almost nobody comes here." One of them was large. Even adding up every referral I could explain (45 from search plus 124 tagged referrers), the untagged "(direct)" bucket was 58 times bigger.
One question before we go further. Is the biggest number on your dashboard in the same order of magnitude as your other instruments? When it isn't, the liar is usually the big one, not the small ones.
How do you separate machines with no user-agent and no IP
My events table has no user-agent and no IP. The columns are app, event, token, locale, created_at, src. The axes people normally use for bot detection simply aren't there.
So I fingerprinted with what was left. I pulled all 7,531 landing rows and looked at four things.
1. Spacing. Clusters of 3 or more events for the same app within 60 seconds accounted for 53% of everything. People do not reload one app at three-second intervals.
2. Clock time. Those clusters repeated at specific hour:minute values. 18:35–18:37, 19:48, 19:51. I opened my scheduler: a short-form publishing job runs at 18:30, an Instagram job at 19:45. Cron time plus a few minutes.
3. File mtime. This was the decisive one. I lined up the modification times of my capture screenshots against the event timestamps.
screenshot  match_ddi_ko/snake-rooster.png        08-17 18:35:18
event       ddi landing ×18 locale=[ko×6, en, en] 08-17 18:35:15
Same incident. My capture code looks like this:
subprocess.run([CHROME, "--headless=new", "--disable-gpu",
                "--screenshot=%s" % out, "--virtual-time-budget=9000", url])
--virtual-time-budget=9000 means "run JavaScript for nine seconds." I added it so screenshots would render properly. Inside those nine seconds the page's analytics code fires. One screenshot became one visitor.
Two weeks ago I wrote a post bragging about this pipeline — one viewport width, 35 apps captured automatically. That post never mentions analytics once. It never crossed my mind.
4. The locale confessed. Among the locale values recorded on the events were these:
en-US@posix en-US@po ko-KR@posix is a value a browser can never send. It is a shell LC_ALL. A headless tool leaked its own execution environment into the field. That one suffix became hard evidence that these were not people.
I filtered, and it still didn't fit
After excluding bursts and POSIX locales, 3,020 rows remained. I could have stopped there and called the rest human. Instead I looked at the hour-of-day distribution.
- All rows: day/night ratio 1.72×
- Filtered remainder: 1.20×
For Korean consumer apps, 4 a.m. drops to 10–20% of peak. 1.20× is essentially flat. 110 events per hour at 4 a.m., 121 per hour in the afternoon. That is not a human rhythm. Search crawlers render JavaScript, and my search report was showing 4,439 impressions, so Google was genuinely walking these sites. The pieces fit.
One day stood out. August 16 alone produced 2,691 rows — 36% of the entire 34-day history. That day, 30 apps each received between 90 and 111 events, almost perfectly evenly. Humans do not produce that distribution. My commit log for that day said "full sweep audit": a design-audit script had walked 43 apps with Playwright.
What was actually broken
If this number were only dashboard decoration I would have laughed it off. The problem is that it was the denominator of a gate.
My app promotion gate reads: "judge after 500 page views; result conversion ≥ 3%; share rate ≥ 10%. Passing means start second-stage investment — add payments, and so on."
And one app had passed. A compatibility app. 723 page views cleared the 500 threshold and a green "threshold met" badge sat on the row.
478 of those 723 (66%) were my own compatibility screenshots. That app renders each pairing in three locales, so it was the most-opened app in the fleet.
My investment signal had been manufactured by my screenshots.
Where would you fix it
Here is the fork. I sat on it for a while.
A. Write better filters. Detect bursts and subtract them, subtract the cron windows, subtract POSIX locales, subtract sweep days like 08-16. Everything I had just done by hand during the analysis. I only needed to move it into code.
B. Change what gets counted.
I held onto A for a long time, precisely because the analysis was already done. But A has no end. Every new piece of automation needs one more filter, and forgetting one silently re-poisons the metric. In fact I had fixed this exact defect three days earlier in a different report, and had not carried that correction into this dashboard — which is why it recurred.
So I went with B. If the gate's question is "do people use this," the denominator has to be something machines cannot manufacture.
- Page loads can be manufactured. I manufactured them, and crawlers do too.
- A token persisted in browser storage is hard to manufacture. Headless runs get a fresh profile every time, and crawlers do not carry storage between visits.
So I changed the unit of seedN: 500 from page views to unique visitor tokens. I left the number 500 untouched. This was not a loosened bar — it was the wrong thing being counted — and touching the threshold at the same time would mix two changes so that later I could never tell which one moved the result.
I also added a new state: "cannot measure." An app accumulating loads while never receiving a single token is neither passing nor failing. It is an app with no way to count people. Showing that as "seed 0/500" makes it indistinguishable from a healthy app that simply has no traffic.
Labels lie too
Events with no source were labelled "(direct)" on my dashboard. That label caused half the misreading. "Direct" reads like someone typed the domain into the address bar. What it actually means is we don't know. I renamed it to "(source unknown)."
I also renamed the table's PV column to loads, added a visitors column in front of it, and changed the default sort to visitors. The order a dashboard shows things in is a statement about what you consider important.
I blocked the production side too
Filtering at aggregation time is not the same as not producing the rows at all. I made the capture and audit tools append ?src=qa-capture and ?src=qa-audit when they open an app. The apps already parsed ?src, so this classifies correctly with no app deploy.
And that turned up one more thing. The app roots looked like this:
export default function RootPage() {
  redirect('/ko');
}
redirect() drops the query string entirely. A link shared as https://app.domain/?src=reddit loses its attribution the moment it passes through that 307. Part of my "source unknown" mountain was this, and it was a landmine for every future channel test.
I could have taken searchParams in the page and reassembled the query, but that turns a static root into a per-request server render. next.config's redirects() preserves query strings by default. The platform already did the job.
async redirects() {
  return [{ source: '/', destination: '/ko', permanent: false }];
}
I kept the old page.tsx as a fallback rather than deleting it. Config redirects are evaluated before filesystem routes, so config wins in practice — and if I deleted the page and the config ever failed to apply, the root would 404.
The numbers after
| Before | After | |
|---|---|---|
| Headline metric | 7,531 page views | 823 visitors |
| Apps at "threshold met" | 1 | 0 |
| "Cannot measure" state | none | present |
No app passes. 823 real visitors across 34 days, with the top app at 144. That is the honest picture.
It is not a pleasant result. A green badge disappeared and several "cannot measure" labels took its place. But it is far cheaper than bolting a checkout flow onto traction that was never there.
Three self-checks
Only the ones you can run against your own pipeline right now.
- Do your screenshot, E2E, or uptime jobs execute JavaScript? If they do, those requests are probably landing in your analytics as people. Put the run times of every headless job next to an hour:minute histogram of your events table.
- Can a machine manufacture your gate's denominator? Page views, request counts, and impressions can be manufactured. Values that require persisted storage — tokens, logged-in sessions, payments — cannot, easily.
- Does a bucket labelled "direct" or "other" hold more than half your total? Then it is not data, it is the fact that you don't know. Renaming it honestly changes decisions by itself.
The honest part
I cannot fix the historical data. QA labels and visitor tokens start today, so the earlier 7,531 rows stay permanently unseparated. The gate no longer depends on loads so judgments are unaffected, but 34 days of history is effectively discarded.
And this defect was a recurrence. Three days earlier I fixed the same structural problem in a different report and did not port the correction here. I already knew that self-traffic inflates metrics, and that knowledge lived in exactly one file. Knowing something and having applied it everywhere are different states.
Finally, I deleted the four events my own verification created. I deleted them by id, not by pattern. There were 85 rows whose source started with qa-, and 82 of them were QA records from other days and other sessions. A convenient pattern delete would have destroyed someone else's history.
Has automation ever polluted your own metrics? I'd like to hear which fingerprint caught it. If you haven't checked, overlay your headless jobs' cron times on your events table's hour:minute distribution. It takes ten minutes.