I keep 37 bots on a control board and look at it daily. But the board only shows what I made
a row for. I diffed it against launchctl list: 18 jobs were outside it, and one whole
project was outside. Six collectors had been running daily since August 26, feeding a live
site, with no monitoring at all.
Inside, it was three layers deep. And the second layer hid the first one for 13 days.
1. Layer one — collecting nothing, succeeding daily
try:
    import yfinance as yf
except ImportError:
    log.warning("yfinance not installed — skipping options section (pip install yfinance)")
    return          # rc=0
It warns and returns. Exit code 0. launchd records success, the log file updates normally. Even artifact-freshness monitoring stays green.
Just install it, right? This job runs on the system python3, and macOS's system python3 blocks package installs under PEP 668. For 13 days it printed "please install it" in an environment where installing is physically impossible. The live site's options section stayed empty the whole time.
2. Layer two — why nobody saw that warning
Open any log in that project and you find thousands of these:
ERROR:...:upsert failed GME/borrow_fee_pct: 409 {"code":"23505",
  "details":"Key (ticker, metric, asof_date)=(GME, borrow_fee_pct, 2026-09-07) already exists."}
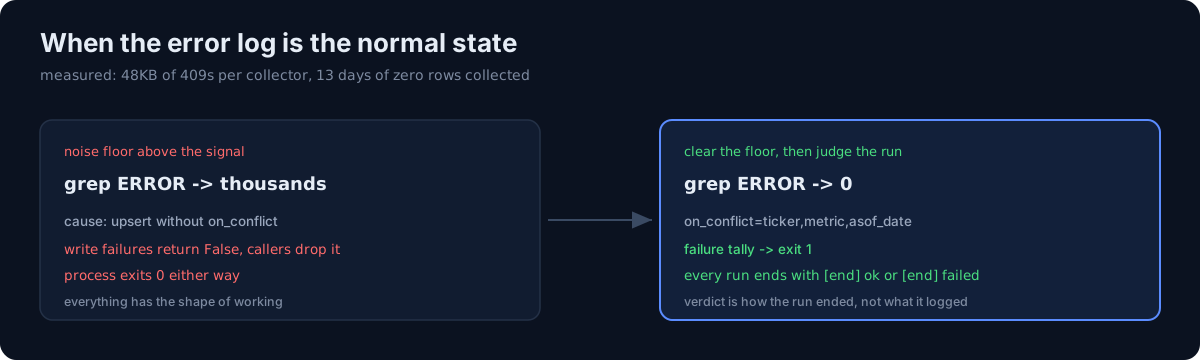
One error log was 48KB. That was the normal state.
The cause was one line.
url = f"{base}/rest/v1/ticker_snapshots"          # no on_conflict
headers = {..., "Prefer": "resolution=merge-duplicates"}
PostgREST's resolution=merge-duplicates needs to know the conflict target. When the
unique constraint isn't the primary key you must pass ?on_conflict=<columns>. Without it,
it's a plain insert, and rewriting the same (ticker, metric, asof_date) 409s every time.
So the upsert was not an upsert. And with hundreds of those failures a day, grepping the
log for ERROR became meaningless. When the noise floor is above the signal, there is no signal.
Pause here. Run grep -c ERROR on your pipeline's log. If it isn't zero and you're not
worried about it — you are already in this state.
3. Layer three — the failure never reached the exit code
upsert() already returned a bool.
def upsert(...) -> bool:
    ...
    if r.status_code not in (200, 201, 204):
        log.error(...)
        return False
All six call sites discarded it. So every write could fail and the process still exits 0. It's in the log, not in the exit code, and the board reads exit codes and artifacts.
4. What I changed
| Layer | Fix |
|---|---|
| Interpreter | Project venv, enforced by the runner. Missing venv → exit 1 |
| 409 flood | ?on_conflict=ticker,metric,asof_date — a real upsert |
| Silent failure | A FAILURES tally plus finish() exiting 1 |
| Run completion | A final [end] ok or [end] failed N line |
| Zero options | Option chains exist every day. Zero is never "no data today" → exit 1 |
That last row matters, and the same rule must not be copied to the other collectors. Fails-to-deliver and short interest publish on long cycles, so zero is normal there. "Zero means broken" is only true for metrics that exist daily.
Result: options data landed for the first time (GME OI 100,084 · max pain 18.5 /
TSLA 224,747 · 357.5). Restarting all six through launchd: [end] ok everywhere, zero ERROR.
5. Putting them on the board showed the opposite
I added six rows and the four I had just fixed came up red, while the one that had collected nothing for 13 days came up green.
The reason was simple. The logs are only written through launchd's StandardErrorPath
redirection. My terminal runs left no line in them. So the logs still held yesterday's
ERRORs, and the options log held only WARNINGs with no ERROR at all.
I moved the verdict from "does it contain ERROR" to "how did the run end"
([end] failed or Traceback), then used launchctl kickstart to actually run all six and
confirm. Same family as
why artifact freshness alone isn't enough — except this
time I made the mistake on the monitoring side.
6. The real fix is the next bot
This is the third time I've missed a bot outside the board. All three times the cause was the same — I never made a row. And all three times a human found it by accident.
So I stopped leaving discovery to accident.
def uncovered():
    """launchd jobs with no board row and no listed exemption."""
    rows = {r[0] for g in FLEET.values() for r in g}
    loaded = ...   # parsed from launchctl list
    return sorted(loaded - rows - set(COVERAGE_EXEMPT))
--selfcheck refuses to go green when this isn't empty, and the board footer shows it in red.
Getting into COVERAGE_EXEMPT requires writing a reason, because that list is the excuse.
Then, rereading my own code, I caught one more thing. When the launchctl query failed,
uncovered() returned an empty list — which would print "0 outside monitoring" as if it
were a fact. I nearly committed the exact class of bug I'd spent the day removing, in the last
line I wrote.
Three self-checks
- Run
grep -c ERRORon your logs. If it's nonzero and you ignore it, that log is no longer a monitoring tool. Clear the standing errors before anything else is visible. - Are you discarding the return value of your write functions? A failure that lives only in the log is invisible to launchd, cron and CI alike.
- Diff
launchctl list(orcrontab -l) against your monitoring list today. I had 18 jobs outside mine.
The honest part
None of the three layers was a hard problem. One line of on_conflict, one return-value check,
one exit 1. The hard part was creating a reason to look. For 13 days these jobs ran daily,
wrote logs, and returned exit code 0. Everything had the shape of working.
Compare launchctl list | wc -l against the number of rows on your dashboard today.
If the two numbers differ, the difference is what you can't see.