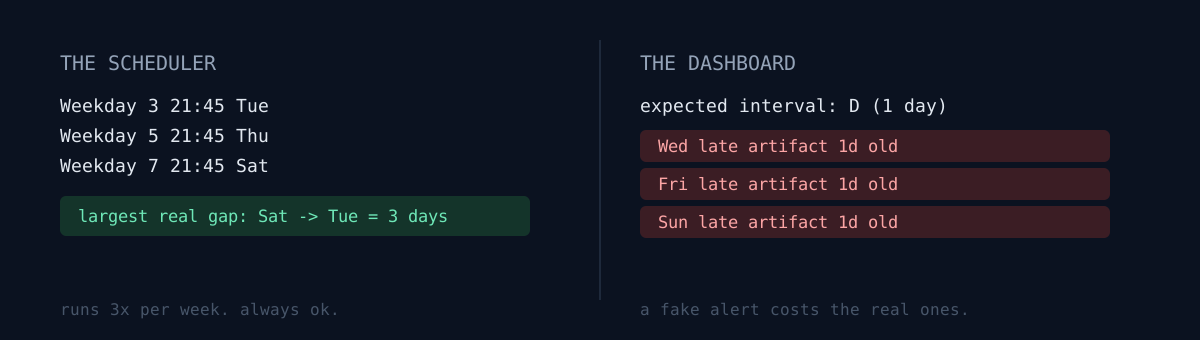
I watch about forty bots on one screen. I decided long ago not to trust exit codes. Instead the board judges output freshness: each job carries an expected interval, and if its newest artifact is older than that, the job is late.
Let me ask you something. Where does your dashboard learn a job's schedule from? Does it read the scheduler, or is it a number somebody typed in once?
Two days a week it was always red
One collector gathers options open interest. On the board it showed up late constantly. Every time I opened the logs, everything was fine: last line [end] ok, artifact present, data correct. Next day, late again.
I looked at the monitor config.
("com.ootssu.sqz.options", "options OI / max pain", D,
 ".../logs/options.err.log", "21:45 · exits failed on zero rows", ...)
D is one day. So: "this job runs daily at 21:45, and if its artifact is older than a day, it's late." Then I opened the actual scheduler file.
Weekday 3  21:45   (Tue)
Weekday 5  21:45   (Thu)
Weekday 7  21:45   (Sat)
Three times a week. Which means on Wednesday, Friday, Sunday and Monday the artifact is correctly older than a day. The board painted much of those four days red, and for weeks I waved it off as "that one again".
The cost of a false alert isn't one alert. It's the habit of not reading the real ones on the same screen. I built the board to kill that habit, and one wrong interval brought it back.
The fix was one line: set the expected interval to the largest real gap in the schedule (Sat → Tue, three days).
# This one runs 3x a week (Tue/Thu/Sat 21:45) — measured from the plist.
# Left at D it blinked late on every idle day. Largest gap is Sat->Tue = 3 days.
("com.ootssu.sqz.options", "options OI / max pain", 3 * D, ...)
The other lie on the same screen: "7-day net"
The same board has a follower growth card showing "daily / 7-day net". The 7-day side had been — for days.
The math was this:
baseline = account.get((asof - timedelta(days=7)).isoformat())
return followers - baseline if baseline is not None else None
You only get a value if that exact date key exists. If the nightly collector fails once, that date is missing, and seven days later the card silently goes — — even though a snapshot sits right there, eight days back.
Here was the fork. What would you do?
- Find the nearest snapshot and label it "7-day net".
- Find the nearest snapshot, but write the real interval into the label.
Option 1 is easier. Nothing looks empty, nobody complains. But it calls an 8-day difference a 7-day one. A card built to show growth rate, lying about its own denominator, is a liability, not an asset.
I took option 2: pick the snapshot closest to seven days within a 6–8 day window, and rewrite the card's own title.
Net over last 8 days      +56
2026-09-02 -> 2026-09-10 · exact 7-day snapshot missing; real span shown
In the same batch I removed the — placeholder. — doesn't distinguish "zero" from "never read". Now it reads "awaiting collection" before the first sample and "no comparison data" when the baseline is missing. Why zero and unmeasured must never share a cell is a lesson I already paid for once.
The two bugs were the same bug
The interval false-positive and the 7-day net are unrelated in code. The cause is identical.
The dashboard never put its own assumptions on screen.
- The first hid the assumption "this job runs daily", so a legitimate gap read as lateness.
- The second hid the assumption "this delta spans exactly seven days", so when the baseline was missing it just went quiet.
A number on a monitoring board must always carry "compared against what". If the comparison isn't on the screen, the reader fills it in from the schedule they remember — and that memory is usually wrong.
Three self-checks
- Have you diffed the expected interval against the scheduler config? A hand-typed number goes silently wrong the moment the schedule changes. I didn't know that job ran three times a week until I opened the plist.
- In your "N-day net" label, is N measured or assumed? One missing snapshot turns N into a lie. Writing the real span into the label makes lying impossible.
- Does your empty-value rendering separate zero from unmeasured? If
—,0andnullall look the same in one cell, your verdicts are already contaminated.
The honest part
Neither fix caught a new outage. Neither improved the growth rate. What I got is one thing: every red light on that screen is now real. That is the dashboard's only product — trust. One fake alert drags down the credibility of the other thirty-nine rows with it.
Open your dashboard and pick one job. Can you say where its expected interval came from? If the answer is "I typed it in once", go open the scheduler config and diff it right now.