While doing the post-mortem on a failed forecasting model, something odd stood out: the 20-day momentum comparator I'd added as a baseline was crushing my model — +132% vs +59% over 232 sessions. When the benchmark outperforms the protagonist, you look. Was it worth promoting to its own track?
Size calculation first. Momentum minus buy-and-hold gave a daily excess t of +1.23 — significance in about 2 years. Every other judgment horizon I'd computed lately was 43, 154, or 59 years, so 2 years is nearly miraculous in this business. Before rejecting it, I split three confounds: window-specific? parameter-specific? symbol-specific?
Have you ever removed your backtest's top contributing symbol and rerun?
Report the whole grid
I swept lookbacks over 5/10/20/40/60/120. Quoting only the best cell is the scan-then-cite-a-single-p sin, so here is the full grid. Six lookbacks × two universes × two windows = 24 comparisons, so Bonferroni significance needs t ≈ 2.9.
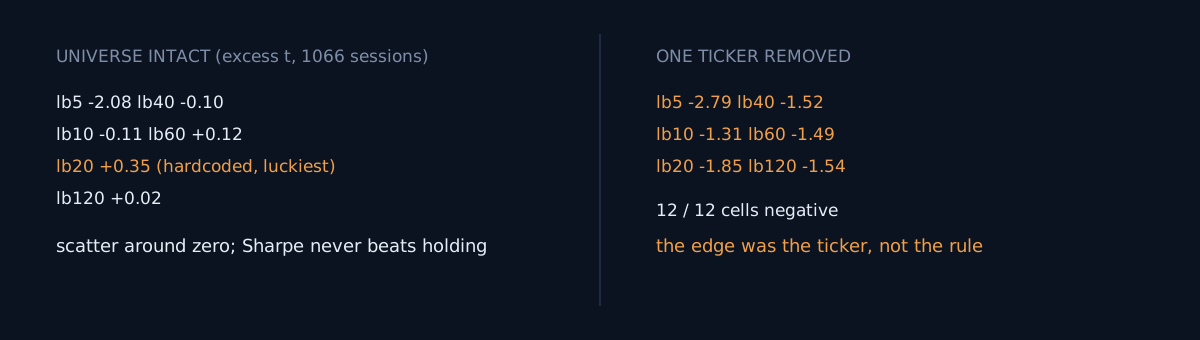
Full 1,066 sessions, universe intact, vs leveraged buy-and-hold:
| Lookback | 5 | 10 | 20 | 40 | 60 | 120 |
|---|---|---|---|---|---|---|
| Excess t | -2.08 | -0.11 | +0.35 | -0.10 | +0.12 | +0.02 |
Scatter around zero. The 20-day value hardcoded in my comparator happened to be the luckiest cell, and even it reads t=+0.35. No cell's Sharpe beat plain buy-and-hold (0.86) or the equal-weight basket (0.94).
Then I removed one symbol
The universe was four ETFs, one of them a 3x leveraged semiconductor fund — during a semiconductor rally. I removed that one symbol and reran the identical grid.
All twelve cells negative, t between -1.07 and -2.79. In the 232-session window the returns read -15.6% / -12.5% / -10.3% / +1.3% / -1.0% / -2.9%. That fits perfectly with the removed symbol returning +197% on its own over the same window. The momentum rule wasn't selecting; it was holding the bull-market ticker.
Rolling windows tell the same story: across 39 rolling 252-session windows the momentum rule beat buy-and-hold in 33% of them, median excess -27.2%, range -106% to +416%. The +390% total wasn't persistent edge — one or two extreme windows dragged it.
That "2 years" was a trap too
The t=+1.23 that tempted promotion was computed from the effect size observed in the most favorable sub-window. Back out a required sample from a favorable window's effect and your judgment horizon is structurally optimistic. Re-measured over the long window: 133 years.
Self-check, 3 items
- Have you removed the top-contributing symbol from your backtest universe and rerun? If the edge disappears, it was the symbol, not the strategy.
- Do you report the parameter grid in full, or quote the best cell? The significance bar rises with every comparison you made.
- Which window supplied the effect size behind your "N days to judgment"? If it was a favorable one, that N is not a floor — it's a wish.
The honest part
I put this comparator in myself. I looked at it in the verdict table every day for three months, and only started doubting the benchmark after the protagonist died. A benchmark doing suspiciously well deserves the same investigation as one doing suspiciously badly.
Try exactly one thing today: pull per-symbol P&L contributions from a backtest, drop the #1 contributor, rerun. Ten minutes — and if the result flips, those ten minutes just saved you months.