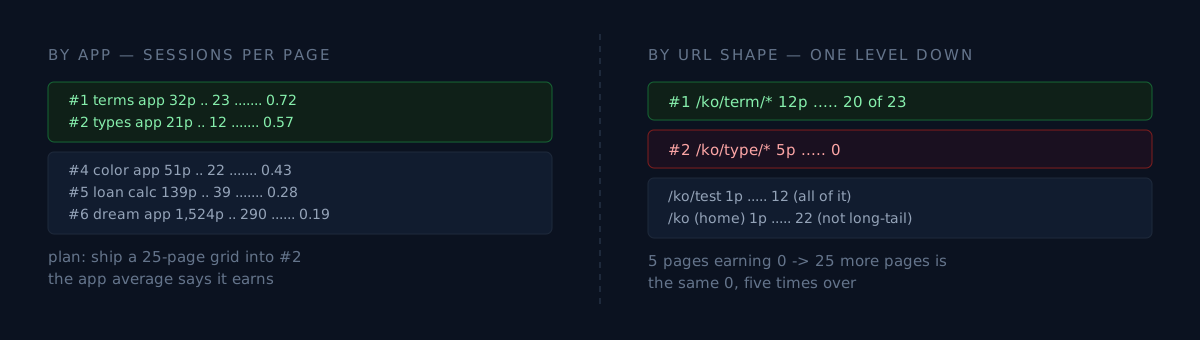
When I pick where to add search pages, I use per-page yield. A big app is not a good app — what matters is how many sessions one page brings in, because that is the only number that says anything about the next 25 pages.
This time I measured all 27 apps that way and picked the winner. But the story here is the one I almost picked: the runner-up, where the app-level number looked fine and the level below it was zero.
One question first. The area you believe is performing well — what unit did that number come from? The service as a whole, or the exact screen type you are about to multiply?
Last time I only looked at what was already open
Two days earlier I made the same kind of call. I wrote "picked by yield" then too. The table I actually looked at had four apps in it, hand-picked — left over from designing a different gate.
Picking the best of those four was fine arithmetic. It just wasn't the best of 27. It was the best of the four that happened to be in a document I already had open. I chose the sample, and my selection criterion was convenience.
So this time I built the measurement first: pull search sessions by host × landing page from analytics, divide by each app's <loc> count in sitemap.xml, and put all 27 in one table.
One design note worth keeping. When the denominator can't be read, it becomes None, not 0.
yield = sessions / pages # what if pages == 0 ?Treat it as zero and either the division blows up, or — if you guarded the division — yield goes to infinity. Then the app whose sitemap you failed to fetch sits at the top of your ranking. Turn a collection failure into empty data and the failure ends up leading the table.
Measuring all of them changed the winner
| App | sitemap | home landings | long-tail | per page |
|---|---|---|---|---|
| fortune-terms app | 32 | 1 | 23 | 0.72 |
| relationship-type app | 21 | 23 | 12 | 0.57 |
| compatibility app | 45 | 4 | 23 | 0.51 (already expanded) |
| color-analysis app | 51 | 3 | 22 | 0.43 |
| loan calculator | 139 | 7 | 39 | 0.28 |
| dream-dictionary app | 1,524 | 8 | 290 | 0.19 |
The biggest app is the worst one. 1,524 pages, yield 0.19. Size runs opposite to yield — an app that already blankets its space has spent the good positions, so the expected value of its next page is low.
Reading that table, I picked #1 (0.72) for the grid and wrote down the follow-up: a 5×5, 25-page grid on #2 (0.57). I had the order planned.
One level down, the answer flipped
While writing that plan I checked one more thing. Those 25 pages on app #2 would live at /ko/type/…. Five pages of that shape already exist. I had never looked at what those five earn.
App #1, /ko/term/* |
12 pages take 20 of its 23 long-tail sessions |
App #2, /ko/type/* |
5 pages take 0. Its 12 all land on /ko/test, its 22 on /ko (home) |
App #2's 0.57 is a real number. The traffic is just arriving at two completely different doors — the home page and one test page. The type shape I wanted to multiply has five pages sitting there and receives not one session.
Two options. What would you do?
- Ship the 25 anyway. It's the #2 app by yield; on average it should earn.
- Don't ship until you know why that shape is at zero.
I took option 2. Adding 25 pages to a shape where 5 pages earn zero is multiplying the same zero by five. Even when the content is free — and it was free here, the computation already existed and the pages only needed URLs — crawl budget and sitemap slots are not.
And app #1 has one more line of evidence behind it: 12 pages of that exact shape are already indexed and already earning 20 sessions. Adding cells there isn't betting on an unproven shape. It's adding to a shape that demonstrably works.
Where the threshold came from
The 12 existing pages yield 1.92 per page over 90 days. Fix the MDE at half of that (0.96/page) and 13 new pages should produce 12.5. Only then did I pick a threshold.
threshold 10 (90-day window, Poisson)
  true 24.9 (same yield as existing)   -> power 1.000
  true 12.5 (the MDE)                  -> power 0.799
  true  6.0 (a quarter of the yield)   -> power 0.084
  true  1.0 (indexed, no traffic)      -> 0.000
The order matters. Set the bar first and compute power afterward and that isn't analysis, it's justification. I have taken a threshold from a different metric entirely before, so this time the MDE came first.
The numerator also counts only the 13 new slugs. Measure the host total instead and the 20 sessions the existing 12 pages already earn get mixed into the same number, so the expansion passes without doing anything. That's the same mistake as my control group growing 4.5x without me, committed on the numerator side.
Three checks for your own work
- Got an area you believe performs well? Re-pull that number at the granularity of the URL shape (or screen type) you actually plan to multiply. Does it survive?
- What does your code do when the denominator can't be read? Treat it as zero and the item you failed to measure becomes your #1.
- How many pages of that shape already exist, and what do they earn today? "Zero pages" is an experiment. "Five pages, zero sessions" is an answer you already have.
Conclusion
An app average is a weighted average across shapes. When one shape earns well, dead shapes hide inside it. My runner-up averaged 0.57, and the cell I wanted to fill was 0.
So the rule got one line shorter: measure yield by URL shape, not by host.
The honest part: nothing here is a win yet. The 13 pages shipped yesterday and, on deploy day, indexed new slugs are of course 0. If indexing is still 0 on 10-29 I stop, and the conclusion then is not "expansion doesn't work" but "never indexed". The real verdict is 12-27, and power at the MDE stays 0.799 — if the truth sits near the MDE, one run in five misses it.
Do one thing today. Take the area you believe is your best performer and build the table that splits it by URL shape. I had never looked behind that average until this week.