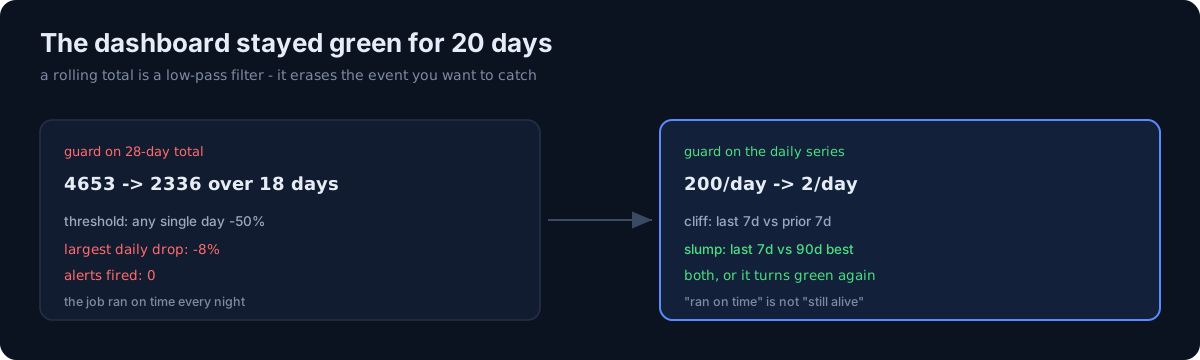
Between August 19 and 20, Google search impressions across my sites dropped from about 200 per day to about 2. That is 99% gone.
I found out 20 days later. The whole time, the fleet dashboard was green, the collector ran at 1am every night, and the log file updated daily. Not a single alert fired.
Does your monitoring metric actually change shape when the event happens?
The threshold existed
It is not that there was no guard. This one was in place:
Warn if total impressions fall by half compared to the previous snapshot.
That sounds reasonable. Search traffic rarely halves in a day. And this guard had earned its place once before: when a property setting changed and the number appeared to go from 3,415 to 88, it correctly said "suspect the measurement before you read this as traffic."
The problem is what it was watching: a 28-day rolling total.
A rolling total is a low-pass filter
Here are the real numbers. The cliff happened in one day. The 28-day total moved like this:
- Aug 21: 4,653
- Aug 25: 4,360
- Aug 30: 3,777
- Sep 5: 2,722
- Sep 8: 2,336
It took 18 days to fall by half. The largest single-day drop was 8%. The -50% threshold was never once touched.
Of course it wasn't. A 28-day window swaps out one day at a time. Even if the event lands in a single day, the total needs 28 days to fully reflect it. A rolling total is defined to smooth noise, and it smooths events with exactly the same indifference.
You cannot put event detection on top of a value designed to erase events.
The second illusion: "it ran on time"
The dashboard was green for a second, simpler reason. That row was watching the freshness of the collector's log file.
The job ran fine every day. The API connected, snapshots were written, nothing failed. The only thing wrong was that the numbers it fetched were dead.
"Did it run?" and "is the result alive?" are different questions. Put them in one row and the first answer buries the second.
What would you do?
Lower the threshold from -50% to -20%? Then it fires every day on normal fluctuation. An alert that fires daily is an alert that is off.
Shrink the window from 28 days to 7? Right direction, but not enough on its own. Here is why.
The fix — split the condition in two
I moved off the total and onto the daily series, then split the verdict.
Cliff — last 7 days vs the prior 7 days. Fires under 40%. Answers: is it collapsing right now?
Slump — last 7 days vs the best 7 days in 90. Fires under 40%. Answers: has it been collapsed for a while?
The second condition is the important one. I ran today's data with only the cliff check and got "normal." The collapse was two weeks old, so both comparison windows sat at the bottom. That is precisely the picture I was trying to fix.
With the slump condition, it reads:
Search traffic SLUMP — last 7 days 21 impressions / best 7 in 90 days 1,783 (1%)
There is one more rule: if the denominator is small, do not judge. If the best 7-day window is under 20 impressions, the ratio is noise, so it returns "cannot judge." The moment you write "cannot judge" down as "normal," you have rebuilt the original bug.
Finally I split the dashboard row. "Did the collection run" and "is the traffic alive" are now separate lines.
Three checks for your own setup
- Is the metric a rolling sum or average? Then any threshold on it is blind to one-day events. Keep the raw series alongside it.
- Is there a condition that catches "already broken"? Rate-of-change alone turns green again a few days after a collapse.
- Are job success and result health in the same row? If so, a healthy job with dead output stays invisible forever.
The honest part
The cliff itself was not my fault. Google rolled out a spam update from August 18 to 21, and my cliff falls precisely inside that window. robots.txt is clean, sitemaps are still being fetched, and the URL Inspection API reports successful crawls. It is the kind of event where I hold no lever.
My fault is not knowing for 20 days. If I had known, I would have shifted effort to another channel sooner. In that same period Naver traffic was climbing from 1 to 46 visits a day, and I was late to that too.
The value of monitoring is not preventing the event. It is knowing the event happened while it still matters. When the metric smooths the event away, that entire value disappears.
Open one of your alert rules right now. Is the threshold sitting on a rolling sum?
Related: One Next.js line that almost deindexed 5 apps · My gate counted one person four times