The core belief behind programmatic SEO is simple: build more pages, capture more long-tail search.
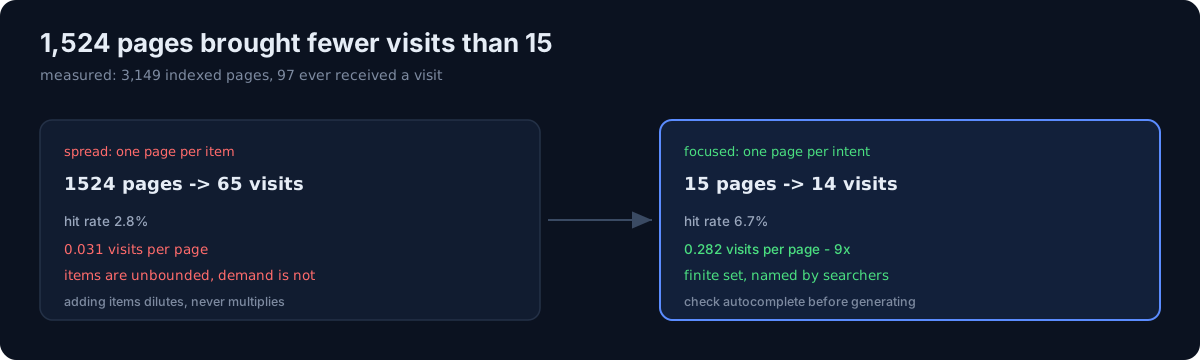
I measured it across my own repo. 3,149 pages sit in sitemaps. Over 90 days, 97 of them received a search visit at all. A 3.1% hit rate.
But the real finding was not the average. It was the distribution.
Do you know what percentage of your programmatic pages ever get a visit?
Hit rate fell as page count rose
Split by app, the direction is unambiguous.
| App | Sitemap | Pages hit | Hit rate |
|---|---|---|---|
| Dream meanings | 1,524 | 42 | 2.8% |
| Tarot | 489 | 9 | 1.8% |
| MBTI | 462 | 5 | 1.1% |
| Net pay | 112 | 14 | 12.5% |
| Talisman terms | 32 | 6 | 18.8% |
| Loan calc | 24 | 2 | 8.3% |
| Attachment style | 15 | 1 | 6.7% |
Apps over 400 pages sit at 1–3%. Apps under 120 pages sit at 6–19%. The more pages you add, the lower the odds that any individual page gets found.
The sharpest contrast: dream meanings gets 65 visits from 1,524 pages; attachment style gets 14 visits from 15 pages. Per page, that is a 20x gap.
Looking at which pages actually got visits
The top list explained it.
14  /ko/type/fearful          (attachment style - fearful)
 7  /ko/loan/30000            (300M won loan interest)
 5  /ko/tone/spring-true      (personal color - spring true)
 4  /ko/pay/6300              (63M salary take-home)
 4  /ko/dream/hornet
 3  /ko/dream/centipede
The top four are finite, named sets. There are four attachment styles. Personal color tones are fixed. Loan amounts and salaries have specific numbers people actually say out loud. The searcher already knows the value before typing.
The bottom is different. The set of objects that can appear in a dream is effectively unbounded, and each one has thin volume. Build 1,524 of them and each returns 2–4 visits.
I started calling these focused and spread. The yields:
- Focused: 0.282 visits per page / 28 days
- Spread: 0.031 visits per page / 28 days
A 9x difference.
So where do the next 200 pages go?
This number decided an actual roadmap call. For the same 200 pages:
- At focused yield: +56 visits/28d (+33%)
- At spread yield: +6 visits/28d (+4%)
Add statistical power and the gap widens. My long-tail baseline is 173 visits per 28 days. Under a Poisson model, the smallest increment detectable in a 28-day window is +30%. Anything smaller only improves with √n as you extend the window.
- Focused 200 pages → verdict in 28 days
- Spread 200 pages → verdict in 2,002 days (about 5.5 years)
Going spread, you can still build them — you just never learn whether it worked. Without running this calculation first, I would have added another 1,000 dream entries.
Which values would you generate?
Once you choose focused, the next question is which values qualify. Fill in arbitrary numbers and you drop straight back to spread yield.
There is a way to check without a keyword tool: search autocomplete. Whether Naver or Google, the autocomplete list is that engine's own tally of real popular queries, which is enough to answer "do people search this value?"
Mine came back like this:
"salary"          -> salary 5000 / salary 4000 / salary 7000 / salary 1억
"salary 6300"     -> salary 6300 take-home / salary 6300 top % / salary 6300 after tax
"100M loan"       -> 100M loan interest / 100M loan interest 5% / ... 4%
The third line surprised me. My loan app has per-amount pages, but the rate was hardcoded at 4.5%. People search with a rate attached and I had no page to receive that query. The amount axis was already dense — the empty axis was somewhere else entirely.
Same for line two. "salary 6300 top %" is a percentile query. The calculation already existed in the app. Only the page was missing.
Three checks
- Have you ever measured hit rate? Pages in your sitemap versus pages that received a visit. Under 3% means adding pages is growing the denominator only.
- Is your parameter set finite? Are these values people know the names of, or combinations you generated?
- Is your existing axis already dense? Then the next pages should not subdivide it — they should open an axis you don't have.
The honest part
This is not a success story. I added 227 pages and the verdict date is five weeks out. I do not know the result yet.
And that 0.282 yield is measured on existing pages. If the new axes fail to rank, it is simply zero. Showing up in autocomplete means "demand exists," not "I will capture it." That is precisely what is being tested.
One more honest note: the absolute scale of this whole channel is small. Long-tail visits run 173 per 28 days. A 33% lift is 57 more visits. So I am treating the value of this experiment as information about whether the channel works, not as revenue.
If you run programmatic pages, measure one thing today: the number of URLs in your sitemap, and the number that got at least one visit in the last 90 days. That ratio tells you what to build next.
Related: Traffic autopsy — I measured every asset · My dashboard stayed green for 20 days