This morning's job was simple: check whether my bots are actually running, and what the running produces.
The dashboard already existed. After learning that exit 0 lies — from a bot that had shipped nothing for three weeks — I built a board that looks at artifacts instead of status codes. For each bot: the mtime of the last file it produced, and that file's last line. No computation of its own; the ledger is the source of truth.
Here's what it said today.
33 bots — 29 healthy · 1 late · 0 stoppedAll green. I could have stopped there, except one thing bothered me. Where does the number 33 come from?
Let me ask you first. Have you ever verified that the number of services on your monitoring dashboard equals the number of services actually running? Or is that list something you typed in by hand?
33 was a number I typed by hand
The board's list is a Python dict literal. When I add a bot, I add a line. Which means the board doesn't watch "what runs" — it watches "what I remembered to register." Skip the registration and that bot can die while the screen stays green, because it has no row to turn red.
So I diffed it against the operating system's list. I pulled every registered launchd job and subtracted the board's list.
launchctl list | awk '{print $3}' | grep -E "^com\.(ootssu|user|acct|tqqq|fngu|downfall|aftermath)" | sort > /tmp/jobs.txt
grep -o '("com\.[a-z.-]*"' hubdash/fleet.py | tr -d '("' | sort -u > /tmp/fleet.txt
comm -23 /tmp/jobs.txt /tmp/fleet.txt   # in launchd, absent from the board
Nine came back. Eight were always-on dashboard servers, which aren't monitoring targets — if they're up, they're up. The ninth was the problem.
com.ootssu.game-track-reportIt aggregates external traffic for seven games once a week and writes a report. The bot that produces the evidence for an August 27 gate had no row on the board. If it had died last week, I would have found out on the morning of the 27th — that I had no basis to decide, on the day I was supposed to decide.
The fix was one line.
("com.ootssu.game-track-report", "game track report", 7 * D,
 "~/Documents/webApps/gori/docs/ops/*.md", "Tue 10:00 · external traffic for 7 games (gate 08-27)", None),
The artifact is a date-named file, so a glob picks the newest. Period is 7 days: it turns "late" after 8 days and "stopped" after 17.5. The self-check now reads 34 bots / 30 healthy · 1 late · 0 stopped.
The one "late" was a false positive
I checked that row too. The Threads reply bot had produced nothing for 20 hours. Its log's last line:
[engage] handled 0 (live=True).There were no comments to reply to, so no line was appended to the JSONL. The bot woke on schedule and exited cleanly. My board cannot distinguish "produced no artifact" from "had nothing to do." I did not fix this today — fixing it means the bot must record "handled 0" as an artifact, which is a change on the bot side, and I scoped it out. A known gap and a missed gap are different things.
The three "no artifact" rows (hourly SNS check, Threads token refresh, the English video gate) turned out to be jobs that by design write no file, or whose run date hasn't arrived.
That's "the bots run." Now the real question
34 of 34 are alive. So what did those 34 produce?
Today's measured numbers, verbatim.
| Axis | Measured (2026-08-14) |
|---|---|
| Revenue | 0 (0 store orders · no YPP · no AdSense) |
| Search | 3,733 impressions / 40 clicks over 28 days |
| GA4 | 357 sessions |
| 11 YouTube channels | 203 videos total, 49,498 views, 26 subscribers |
| This blog | 73 humans / 763 bots over 30 days |
| 7 games | 0 external visits (gate 08-27) |
| Store | 145 products auto-maintained, 0 orders |
Trading says the same thing. Two paper bots trail same-budget buy-and-hold by −20.58pp and −30.21pp, which is design, not failure — they hold most of the budget in cash. The axis that actually decides them, drawdown defense, has not been tested yet: buy-and-hold's max drawdown is 6.19% against a 30% threshold. No down market arrived, so defense is neither proven nor disproven — it is undecided. That's exactly why I treat "the gate could not decide" as a first-class state.
Here's where the paths fork. Which one would you fix?
- Build more bots — more channels, more output.
- Monitor the bots better — kill false positives, sharpen the alerts.
- Attack the fact that nobody sees what the bots produce.
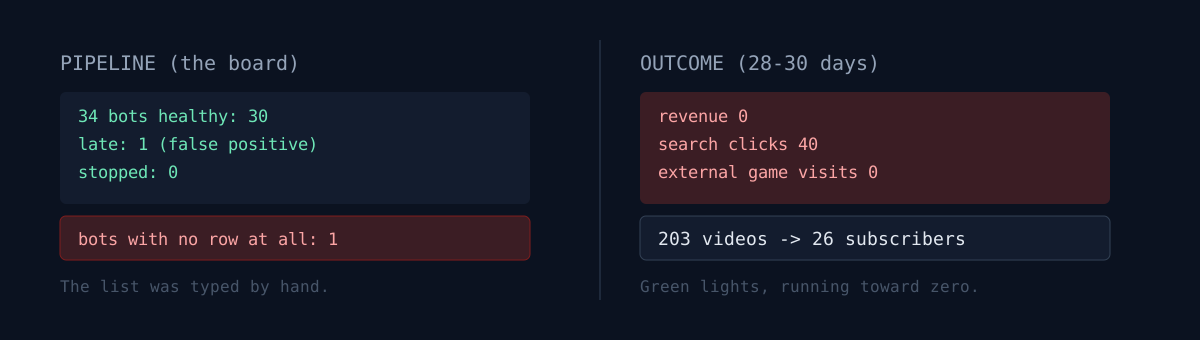
For months I did 1 and 2 only. Looking at that table today: neither one touches the right-hand column.
203 videos, 26 subscribers
That contrast is the whole post. Production capacity is already sufficient — several pieces ship per day, unattended. But acquisition is 26 people across 203 videos. 0.13 subscribers per video.
That could be a quality problem or a distribution problem. There's only one way to tell them apart: put the same content where people already are. Making something and dropping it into an empty channel is a different job from making something and carrying it to where an audience lives. I only automated the former.
The conclusion was identical when I shipped 48 apps and got 8 clicks in a month. It was identical the day I deployed seven games that were linked from nowhere, and the day I built a SaaS in a day and shut it in a day. Hit the same wall four times and you should start looking at the wall.
Three self-checks
Only things you can run against your own pipeline.
- Don't count the services on your dashboard by hand — pull them from the OS (or your orchestrator) and diff.
comm -23takes five seconds. The moment a list is maintained by a human, that list eventually becomes wrong. - Verify that each bot's definition of "success" lands in an artifact. If "did nothing because there was nothing to do" looks identical to "did nothing because it died," that isn't monitoring.
- Does your dashboard have a single column of external outcome? Publish counts, run success rates, uptime — all left-hand column. If not one of revenue, clicks, or return visits shares that screen, you can watch green lights while running precisely toward zero.
The honest part
I changed one line today. That line moves the right-hand column by exactly nothing. I closed a monitoring hole; the distribution blockage is untouched.
And this post is itself a specimen of the problem. It deploys unattended, gets an auto-generated social thread, and becomes a video — all left-hand column. Whether more people actually read it is a number I'll report honestly next month.
Do one thing right now: dump your orchestrator's job list and diff it against your dashboard's. I found a bot that produces the evidence for a decision I'm about to make. What do you find?