A paper experiment trading ETF daily closes with a time-series foundation model (TimesFM 2.5) failed its historical screen at -31.6%. I had to split the blame: stop-loss rule, costs, or the model itself.
So I verified the integration at source level first. Do you trust a library's return value from its docstring, or from its source?
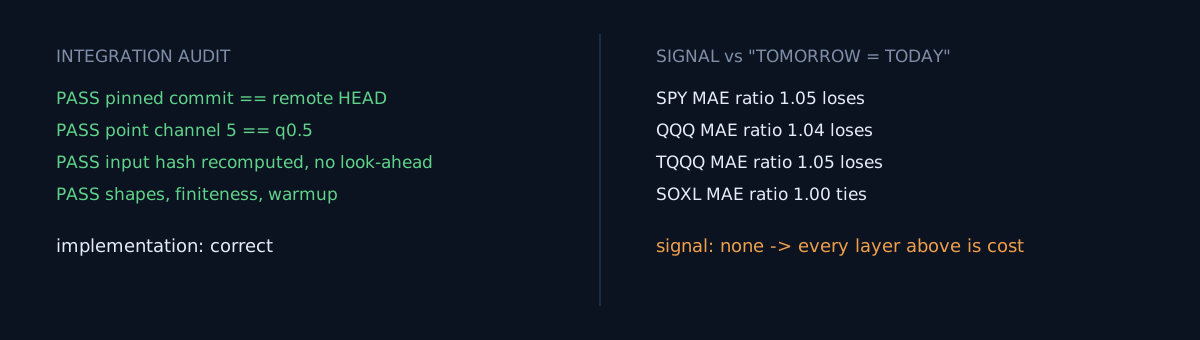
The integration was entirely correct
- The pinned commit matched remote HEAD via
git ls-remote; the installeddirect_url.jsoncarried the same commit id. - What does the returned
pointactually mean? Traced the source:return full_forecast[..., 5]— with 10 channels laid out as[point head, q0.1..q0.9], channel 5 is exactly q0.5, the median. Mymedian_returnlabel was right. - Look-ahead check: recomputed the stored input hash independently from the database — identical. No future bar leaked into the inputs.
Most audits stop here and file it as "implementation clean." I almost did.
Then I measured the signal itself
68 signal days × 4 symbols, predicted vs realized next-day returns:
| Symbol | corr(pred, next) | Sign hit | Model MAE ÷ random-walk MAE |
|---|---|---|---|
| SPY | +0.046 | 50.0% | 1.05 |
| QQQ | -0.020 | 50.0% | 1.04 |
| TQQQ | -0.025 | 52.9% | 1.05 |
| SOXL | +0.191 | 45.6% | 1.00 |
The last column is the whole story. In all four symbols, the model's forecast error is equal to or worse than the naive forecast "tomorrow's close = today's close." It's a paired comparison agreeing 4 out of 4, so the conclusion stands without arguing about the significance of any single correlation.
One trap: pooling all symbols gives a correlation of +0.148 — a very quotable number. It's manufactured by scale: high-volatility symbols have big predictions and big realizations, so mixing them creates correlation out of nothing. Split by symbol and the zero shows.
Which number would you have put in the report?
What the model was actually doing
The correlation between the prediction and the previous day's realized return was -0.41 to -0.53 across all four symbols. This model's daily forecast isn't information about tomorrow — it's an echo of yesterday's move, flipped. So the strategy always bought whatever fell hardest yesterday, and with a -3% stop on 3x ETFs that produced 11 stops and 0 take-profits. It looks like an execution-rule outcome; it's a signal outcome.
One more: the model predicts close to close, but the strategy entered at the open. 52.8% of absolute price movement happened in the overnight gap, and the gap's correlation with the remaining intraday move was +0.034 — even a perfect close predictor couldn't trade half of what it knew. Preregistration doesn't help when the predicted quantity and the traded quantity are different quantities.
Self-check, 3 items
- Before building on a new predictor, did you compute its MAE ratio against the naive random walk? If it can't break 1.0, there's no reason to build the execution layer.
- Did you compute correlations per symbol, or pooled? Pooled correlation is a volatility-scale artifact.
- Is the quantity your model predicts the same quantity your strategy trades?
The honest part
This signal check takes half a day. I built the whole execution layer first — fill model, gates, minute-bar validation — ran a three-month backtest, and only then measured the signal. Same disease as the gate that needed fifty-nine years: I did the arithmetic last.
Try exactly one thing today: for any predictor you're running, compute mean(|pred - real|) / mean(|real|) per symbol. If nothing comes in under 1.0, everything built on top of that model is pure cost.