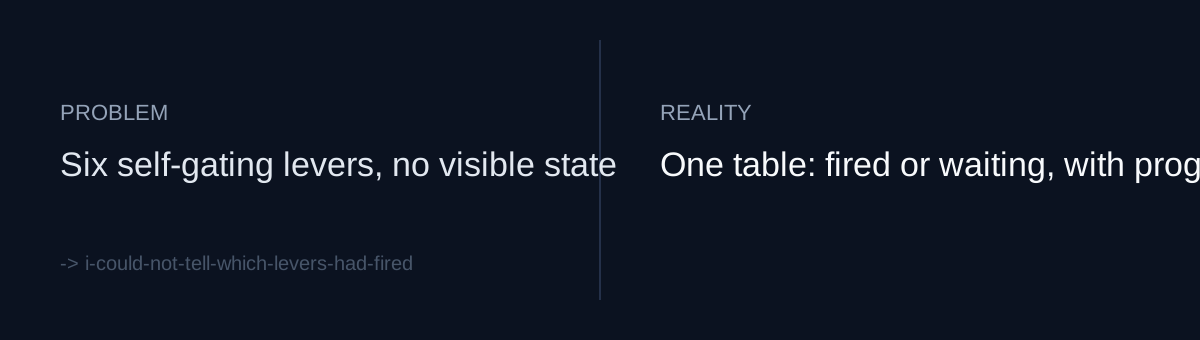
A lever that switches itself on is the only one that knows it did
My YouTube automation pipeline has several self-gating improvement levers. Each one does nothing until a condition is met, then acts once the data crosses a threshold. There are six: app ordering, retention hints, creative DNA, category performance, repackage flags, and series playlists, spread across both Shorts and long-form.
The intent was sound. These gates exist so the system doesn't react to thin samples. But the design had a gap: from the outside, a lever that is quietly waiting looks exactly like a lever that is quietly broken.
The dashboard had one table, for channel metrics. Views and subscribers were visible. Which of the six levers had fired, and which were still below their bar, was not visible anywhere. Checking meant opening each lever's output file by hand.
If your project has logic that turns itself on when conditions are right, could you say in five seconds whether it is on right now?
Where to read from mattered more than what to show
Adding a table is easy. The real question was the data source. The existing channel table calls an API and caches the result for 15 minutes. Putting gate status on that same path would cause two problems: more API calls every time I wanted to check state, and gate status tied to the channel cache, so up to 15 minutes late.
What would you do: put the status panel on the existing API cache path, or keep it separate?
I kept it separate. Every lever already writes local artifact files, so the panel reads only those. It makes no API calls and sits outside the 15-minute channel cache.
What I added
The dashboard now has a second table. Each row is one lever, and the state is one of two symbols: ● fired or ○ waiting. Next to it sit the current value and the threshold, so a waiting lever shows how far it is from its bar.
The row-building logic is split out into a pure function, _gate_rows(). With file reading and rendering removed, it is just input to rows, so tests can feed it fake artifacts. The change is 96 lines in the dashboard and 66 lines of tests.
Self-check
- For every piece of conditional logic, is there somewhere you can see fired versus waiting without opening the code?
- For logic that is waiting, can you see the current value next to the threshold, or do you only know it hasn't fired yet?
- Is your status display tied to another data source's cache or API calls, so it shows up later or costs more than it should?
The honest part
This panel doesn't make any lever fire sooner. Whether a lever crosses its threshold depends on how fast data accumulates, and there is no cheap fix for that. All the panel does is make waiting and broken look different. It also only reads local artifact files, so if the job that writes those files stops, the panel can keep showing stale state. Checking whether the files are fresh was outside the scope of this change. And the table can't tell me whether a fired lever actually improved anything. It only says the lever turned on.