I was adding a feature that turns a territory you walked into an eight-second video you can share. Conceptually simple: draw 240 frames onto a canvas, encode them as H.264 with WebCodecs.
The first run took 25.8 seconds. Twenty-six seconds to produce eight seconds of video. You cannot ask someone to tap "share" and then wait that long.
When your pipeline is slow, what do you suspect first?
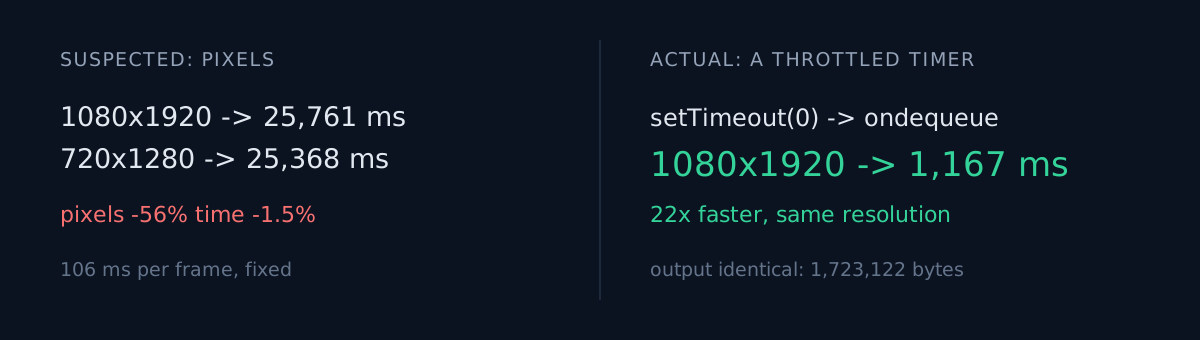
I suspected pixels. 1080x1920 is two million of them per frame, half a billion across 240 frames — and every frame redrew a whole map image with drawImage. My own design doc had written this risk down in advance: "if encoding exceeds 8 seconds, drop to 720x1280 or shorten the reel to 6 seconds."
So I dropped it
720x1280 is 44% of the original pixel count. Less than half.
1080x1920   25,761 ms
 720x1280   25,368 ms
Four tenths of a second. I cut the pixels by more than half and the clock moved 1.5%.
This is the moment that matters. It is not "less improvement than hoped." It is proof that pixels were never the bottleneck. If pixel work had dominated, cutting it to 44% would have dragged the time down with it. It didn't, so the time was living somewhere pixels can't reach.
240 frames in 25.4 seconds is about 106ms per frame — a suspiciously round, fixed number. That is not the smell of computation. That is the smell of waiting.
The culprit
If you push frames into an encoder without limit, raw frames pile up in memory. At 1080x1920, 240 of them is roughly 1.5GB, and a phone will simply kill you. So I had added backpressure:
if (encoder.encodeQueueSize > 8) {
  await new Promise((r) => setTimeout(r, 0));
}setTimeout(0). It looks harmless — it just yields to the next macrotask.
The problem is where this page runs. The renderer runs in an offscreen WebView inside the app, and when I review it in a browser it runs in a background tab. Both throttle timers hard. A yield that costs 1ms in the foreground costs ~100ms here.
I wasn't waiting on the encoder. I was waiting on a timer.
The fix
WebCodecs already has the right event for this.
encoder.ondequeue = () => notifyDequeue?.();

while (encoder.encodeQueueSize > MAX_QUEUE && !encodeError) {
  await waitForDequeue();
}
It is an encoder event, so nothing throttles it. The result:
1080x1920 1,167 ms (draw 44 / submit 47 / wait 976 / flush 54)25,761ms to 1,167ms. A 22x speedup. At the original 1080x1920, with the output mp4 coming out at 1,723,122 bytes — byte for byte identical. I gave up nothing in quality.
And now that the breakdown ships with the result, it is obvious that the remaining 976ms is the actual encode. Next time this gets slow, I won't have to guess. Instrumentation is not the end of it, though — my error monitor spent three days reporting an outage that had already ended.
Why my design doc was wrong
My spec said: "if encoding exceeds 8 seconds, drop to 720x1280 or shorten the reel."
As a plan, that is reasonable. But that sentence had already assumed pixels were the bottleneck. Had I skipped the measurement and followed the plan, I would have shipped a 25-second pipeline with worse image quality, and concluded that phones are just slow.
A cheap fix sitting ready is the most dangerous thing in a performance investigation. It stops you from finding the real cause. A tool's defaults once wrote my conclusion the same way — a report that only held the top 10 rows, and I called it "no demand".
Three things to check right now
If you have a slow pipeline today:
- Halve the input size. If the time doesn't fall proportionally, that input is not your bottleneck. Five minutes to find out.
- Divide total time by item count. If per-frame, per-row or per-request time is a clean fixed number, you're waiting, not computing.
- Look for
setTimeoutorsleepinside the loop — especially if that code ever runs somewhere timers get throttled: a background tab, an offscreen WebView, an unfocused window.
The honest part
This was a bug I wrote. The backpressure itself was necessary and still is — without it a phone dies. What was wrong was reaching for a timer to implement it. I had quietly believed setTimeout(0) means "immediately," and that is only true in a foreground tab.
And the whole finding came from five minutes of changing the resolution. Without that control experiment I would still be optimising drawImage.
Is there a timer inside your render loop? And is the place that code runs really in the foreground?